Download
1 / 68
680 likes | 794 Views
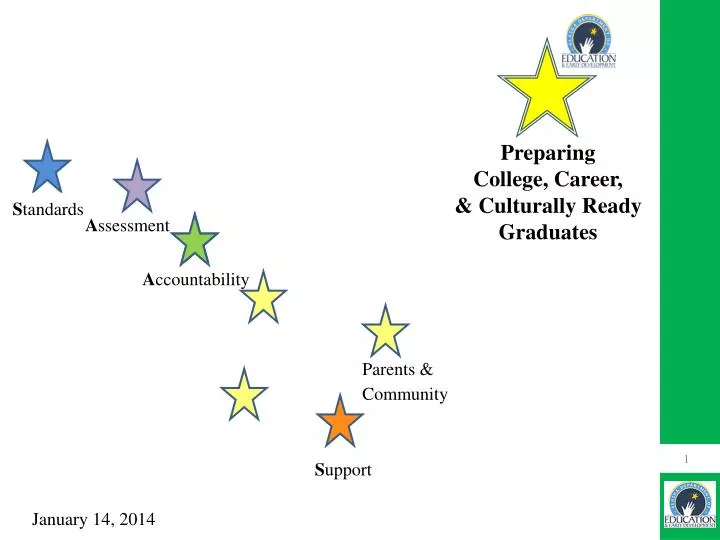
Preparing College, Career, & Culturally Ready Graduates. S tandards. A ssessment. A ccountability. A ccountability. Parents & Community. S upport. January 14, 2014. A ccountability. Teacher & Principal Accountability. School & District Accountability. Goals Today.

E N D
Preparing College, Career, & Culturally Ready Graduates Standards Assessment Accountability Accountability Parents & Community Support January 14, 2014
Accountability Teacher & Principal Accountability School & District Accountability
Goals Today After this presentation you will • Understand the purpose, process, and metric of both ASPI and the AMOs; • Be able to read and explain the ASPI worksheet; • Know where to find information and resources about Alaska’s school & district accountability system.
2 Note Taking Tools 1. Sample ASPI Worksheet 2. ASPI Components Graphs
Handout ASPI SCHOOL WORKSHEET
Question Protocol for Learning Clarifying questions- ask in the moment! Detail questions, analytical questions, district-specific questions- write them down; we’ll answer them once everyone has the Big Idea. Concerns & feedback- write them down; as time allows we will listen and take notes to bring back to the EED team. If we aren’t able to fully discuss your concern/feedback at this time, please email Elizabeth and she will take it to the team.
ESEA Flexibility Waiver from NCLB • ESEA Flexibility Waiver application submitted in October 2012 • Approved by US Department of Education in May 2013 • Permitted Alaska to develop new regulations for school accountability • Those regulations approved by the Alaska State Board of Education in June 2013
The New Accountability System Replaces • Adequate Yearly Progress (AYP) • Expectation that 100% of students are proficient by Spring of 2013-2014 school year • Annual Measurable Objectives for 2012-2013 school year were 94.28% proficient in Language Arts; 91.53% proficient for math • Consequences of not meeting AYP • Corrective action • Restructuring • Restricted use of Title funds • School Choice • SES
Alaska School Performance Index (ASPI) Annual Measurable Objectives (AMOs) Alaska’s New Accountability System
Participation Rate Participation Rate is calculated by dividing the number of students tested in a school by the number of students enrolled. The Participation Rate drives the calculation used for the Achievement score. • If the school meets or exceeds 95% participation in the standardized tests, only the students who assessed are included in the calculation for the Achievement score. • If the school does not meet 95% participation, any students who were not assessed but were enrolled will be counted as not proficient in the Achievement score calculation. If a school has 40 or fewer students enrolled in the assessed grades (3‐10), the requirements for participation are satisfied if two or fewer students do not participate in the state assessments.
Participation Grades 3-10
Academic Achievement • Average of % of students proficient or above in reading, writing, and math. • Example: 100 students tested • 85% proficient in reading = 85 students • 80% proficient in writing = 80 students • 75% proficient in math = 75 students • Total # proficient R, W, M • 85 students + 80 students + 75 students = 240 students • Average % proficient • 240 students / 300 tested students = 80% proficient
School Progress • The progress from the previous year’s Standards Based Assessments. • Calculated for five groups of students: All Students & the four subgroups of students with the highest achievement gaps in Alaska: • Alaska Native • Economically Disadvantaged • Limited English Proficient • Students with Disabilities
School Progress: In the Future 2015 Vertically Aligned Assessments • Features a continuous scale from 0 to infinity. • The continuous scale means that a student who improves by 10 points between 3rd and 4th grades (moving from 204 to 214) has improved just the same as a student who improves by 10 points between 5th and 6th grades (moving from 219 to 229). • Equal interval feature makes measuring growth of individual students easy and reliable.
School Progress: In the Future Probable range of next year’s scores; shows how much growth will be necessary for this student to achieve the next proficiency goal. Scale Score & Achievement Level Growth percentile between grades Growth Percentile & Growth Level
School Progress 2012, 2013, 2014 • The progress from the previous year’s Standards Based Assessments. • Calculated for five groups of students: All Students & the four subgroups of students with the highest achievement gaps in Alaska: • Alaska Native • Economically Disadvantaged • Limited English Proficient • Students with Disabilities
Alaska Standards Based Assessments (SBAs) Proficiency Levels The student score only gives a description of the student’s scale score relative to the GLE. See Alaska School Performance Index (ASPI) Worksheet Explanation, Appendix A page 5
Growth & Proficiency Index See Alaska School Performance Index (ASPI) Worksheet Explanation, Appendix A page 5
Example In grade 7 reading, student earned a scale score of 297. The following year, in grade 8 reading, student earned a scale score of 303.
Example: Proficiency Levels In grade 7 reading, student earned a scale score of 297 (BP+). The following year, in grade 8 reading, student earned a scale score of 303 (Pro).
Example: Growth & Proficiency Index In grade 7 reading, student earned BP+ . In grade 8 reading, student earned a Pro. This student has a growth and proficiency index score of 120.
80 x 35% = 28 ASPI points 94.11 x 40% = 37.64 ASPI points
Triad activity (3minutes) Appendix A: School ProgressLook at example on page 6 • What factors remove a student’s score from the school’s calculation? • When you think about your school, how might your subgroup scores effect your school growth score?
Attendance Rate Average attendance of all students. • Example: • 100 students total • 16,100 combined days of attendance • 17,000 days of membership (@170 days each) • 16,110 / 17,000 = 94.7% attendance rate
95 x 25% = 23.75 ASPI points 80 x 35% = 28 ASPI points 94.11 x 40% = 37.64 ASPI points
95 x 25% = 23.75 ASPI points 80 x 35% = 28 ASPI points TOTAL ASPI POINTS = 89.39 94.11 x 40% = 37.64 ASPI points
80 x 20% = 16 ASPI points 94.7 x 10% = 9.5 ASPI points 94.11 x 40% = 37.64 ASPI points
Graduation Rate Use higher of 4-year or 5-year cohort rate (required graduation rate formula)
Graduation Cohort Formula The number of students who entered the school in grade 9 who graduate either 4 or 5 years later, minus students who transfer out of school. Students who transfer in join the cohort of their origin. The ASPI scores published in the fall of 2013 were based on the following cohorts.
80 x 20% = 16 ASPI points 90 x 20% = 18 ASPI points 95 x 10% = 9.5 ASPI points 94.11 x 40% = 37.64 ASPI points
College & Career Ready Indicator Calculated by dividing the combined value of all grade 12 scores by the combined count of grade 12 students who attempted any qualifying test. • Qualifying scores earned in WorkKeys, ACT, or SAT assessment. • Includes current 12th graders tested in either 11th and/or 12thgrades. • The test score leading to the highest number of ASPI points will be used.
College & Career Ready Indicator 25 12th graders; 25 took assessment(s) 17 earned qualifying points 3 x 100 = 300 points 6 x 95 = 570 points 8 x 80 = 640 points • 1,510 points/25 students = 60.4
60.4 x 8% = 4.83 ASPI points 80 x 20% = 16 ASPI points 90 x 20% = 18 ASPI points 95 x 10% = 9.5 ASPI points 94.11 x 40% = 37.64 ASPI points
College & Career Ready Assessment Participation Rate • Percentage of grade 11 students who take WorkKeys assessment (required by regulation).
60.4 x 8% = 4.83 ASPI points 0 x 2% = 0 ASPI points 90 x 20% = 18 ASPI points 80 x 20% = 16 ASPI points 94.11 x 40% = 37.64 ASPI points 95 x 10% = 9.5 ASPI points
60.4 x 8% = 4.83 ASPI points 0 x 2% = 0 ASPI points 90 x 20% = 18 ASPI points 80 x 20% = 16 ASPI points 94.11 x 40% = 37.64 ASPI points TOTAL ASPI POINTS = 85.82 95 x 10% = 9.5 ASPI points