Download
1 / 53
530 likes | 629 Views
T3.4 Predictive Modeling to Plan Enrollment, Financial & Facility Resource Needs________ Use Mobile Guidebook to Evaluate this Session. Please Silence mobile devices. SACRAO 2014 T3.4 Predictive Modeling to Plan Enrollment, Financial & Facility Resource Needs

E N D
T3.4 Predictive Modeling to Plan Enrollment, Financial & Facility Resource Needs________ Use Mobile Guidebook to Evaluate this Session. Please Silence mobile devices.
SACRAO 2014 T3.4 Predictive Modeling to Plan Enrollment, Financial & Facility Resource Needs Rodney Miller, Dean of Records Covenant College, Lookout Mountain, GA
Some of the common questions I have been asked by fellow administrators: • How many new students do we expect to enroll? • How many total students do we expect to enroll? • How many beds do we need? • How many beds will be have available? • When do we need to have a new residence hall completed?
Some of the common questions I have been asked by faculty departments: • How many seats and sections of _________ do we need next year? Core requirements - Typical Freshmen Courses: Old Testament, English Composition, fine arts, humanities, social science, physical education Major Courses: based on # of new English majors, how many introductory English courses.
Some of the common questions I have been asked by faculty departments: • How many seats and sections of _________ do we need next year? Core requirements - Typical Freshmen Courses: Old Testament, English Composition, fine arts, humanities, social science, physical education Major Courses: based on # of new English majors, how many introductory English courses. (Forecast how many students, and what kind?)
Concerns of making Predictions: • I don’t have the training! • (I am not a statistician) • I don’t have the data or the tools! • (I cannot learn a little Excel) • I am afraid I won’t be accurate! • (I cannot look like a fool to my boss)
Concerns of making Predictions: • I don’t have the training! • (I am not a statistician) • I don’t have the data or the tools! • (Can you learn a little Excel) • I am afraid I won’t be accurate! • (I cannot look like a fool to my boss) • Think outside the box - Be BOLD, Take RISKS (What if you’re close?)
Forecasting Defined Forecasting is… A prediction of what will happen in the future given some assumed set of circumstances.
Forecasting Defined Forecasting is… A prediction of what will happen in the future given some assumed set of circumstances. Forecasts are developed… By combining quantitative methods with expert knowledge and managerial insight.
The Role of Forecasting • Short Term: Scheduling of existing resources Acquiring additional resources • Long Term: Strategic planning for future resource needs and options
The Role of Forecasting • Short Term: Scheduling of existing resources Acquiring additional resources • Long Term: Strategic planning for future resource needs and options You must know your institution, because: Forecasting is a Process! It Is Both An Art and a Science
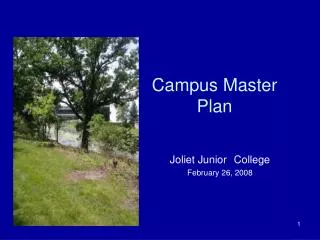
Covenant started in 1955 in Pasadena, CA for one year, before moving to St. Louis, MO. Started Covenant Theological Seminary, outgrew location.In 1964, it moved to Lookout Mtn, GA into the old Castle in the Clouds Hotel (building in 1928)
Covenant is a Christ-centered institution of higher education, emphasizing the liberal arts. • Affiliated and operated by the Presbyterian Church in America (PCA) • Our goal is to equip our students as biblically grounded men and women to live out extraordinary callings in ordinary places.
A little about Covenant College - Fall 2013: • Number of Students: 1045 UG; 69 GR • (1114 Total) • UG Student-to-Faculty Ratio: 14 to 1 • UG Average Class Size: Approx. 23 • UG Faculty: 69 full time; 90% of faculty hold doctorate or terminal degree (10% taught of classes taught by adjuncts) • UG Participation in Varsity Sports : 34% • 1st year full membership – NCAA DIII • UG Most Popular Majors: • Art, Education, English, History, Sociology
In my 26 years at Covenant, we have: • Grown from 488 to 1132 students, • Added majors and faculty, and doubled the number of buildings, • Implemented 3 different administrative software systems, and • Experienced challenges trying to predict our future needs
Challenges of Achieving an Accurate Forecast • Lack of data, too much data or poor quality data
Challenges of Achieving an Accurate Forecast • Lack of data, too much data or poor quality data • Lack of understanding of customer needs, market characteristics and economic conditions
Challenges of Achieving an Accurate Forecast • Lack of data, too much data or poor quality data • Lack of understanding of customer needs, market characteristics and economic conditions • Lack of resources (a skilled analyst)
Challenges of Achieving an Accurate Forecast • Lack of data, too much data or poor quality data • Lack of understanding of customer needs, market characteristics and economic conditions • Lack of resources (a skilled analyst) • The future cannot be predicted with certainty, especially when working with 18-21 year olds!
Forecasts = Pattern +/- Randomness Patterns are quantitative methods of determining correlative actions based on statistical analysis of historical data.
Forecasts = Pattern +/- Randomness Patterns are quantitative methods of determining correlative actions based on statistical analysis of historical data. Randomness is a qualitative judgment that relies on intuition, expert opinion, market knowledge, and knowledge of your students and constituents. God’s providence; others call “luck”
How do develop a forecast? If you have research staff in your office, GREAT, use them!
How do develop a forecast? If you have research staff in your office, GREAT, use them! If not, establish your own simple research, looking for patterns – assumptions. But, you don’t have to be a statistician!
How do develop a forecast? If you have research staff in your office, GREAT, use them! If not, establish your own simple research, looking for patterns – assumptions. But, you don’t have to be a statistician! Become comfortable with the margin of error based on our assumptions (again, given 18-21 year olds).
Convert Observed Patterns into Quantitative Assumptions for Predicting Total Enrollment What are the key variables for predicting Total Enrollment? (Audience Participation!!!!!)
Convert Observed Patterns into Quantitative Assumptions for Predicting Total Enrollment What are the key variables for predicting Total Enrollment? • New Student Enrollment Goals (or Limit) • % FR, SO, JR, or SR
Convert Observed Patterns into Quantitative Assumptions for Predicting Total Enrollment What are the key variables for predicting Total Enrollment? • New Student Enrollment Goals (or Limit) • % FR, SO, JR, or SR • Fall-to-Fall Retention Rates – Class Level • % FR stay FR -- % FR to SO • % SO stay SO -- % SO to JR • % JR stay JR -- % JR to SR • % SR stay SR
Convert Observed Patterns into Quantitative Assumptions for Predicting Total Enrollment What are the key variables for predicting Total Enrollment? • New Student Enrollment Goals (or Limit) • % FR, SO, JR, or SR • Fall-to-Fall Retention Rates – Class Level • % FR stay FR -- % FR to SO • % SO stay SO -- % SO to JR • % JR stay JR -- % JR to SR • % SR stay SR ? Do we use Cohort only or all students? (Audience?)
What are the key variables for predictingNew Student Enrollment? The FUNNEL - numbers • Institutional Fit • High School GPA of College Prep Curriculum • Test Scores – SAT/ACT, specially Critical Reading/English in a liberal arts school • Financial Need • Class Level Percentages Rates (e.g. 15th of 100) • Application Date, or Deposit Date
What are the key variables for predictingNew Student Enrollment? The FUNNEL - numbers • Institutional Fit • High School GPA of College Prep Curriculum • Test Scores – SAT/ACT, specially Critical Reading/English in a liberal arts school • Financial Need • Class Level Percentages Rates (e.g. 15th of 100) • Application Date, or Deposit Date • Covenant worked with a consultant, and we don’t fit their usual models given our market niche.
What are the key variables for predictingCourse Needs? • History of course offerings: Course sequencing within the major 8-semester planning tools • Student body characteristics: # in major class level • Room availability
What are the key variables for predicting Residence Hall Needs? • Availability of Housing: Percentage of capacity utilized Need to take units off-line for maintenance • Philosophy of Residence Life: Class level inclusion vs. dedicated halls (e.g. freshman halls, honors, athletics)
What are the key variables for predicting SACRAO LAC Room & Food Guarantees? • How many rooms to guarantee with hotels • How many meals to guarantee for : • Sunday Partner Reception • Tuesday Big Event • Wednesday Breakfast
Start a total enrollment model with an algebraic formula. • Organize your data. (continually changing that) • Who liked High School Algebra? (LB?) • Create a spreadsheet with your data. • Know that you will have to change it as you continue to use it for: • More efficient display • Maintenance of historical information • To predict the Fall 2014 Total Enrollment from August – December 2013, the first formula:
Start a total enrollment model with an algebraic formula. • Organize your data. (continually changing that) • Who liked High School Algebra? (LB?) • Create a spreadsheet with your data. • To predict the Fall 2014 Total Enrollment from August – December 2013, the first formula: • Projected Fall 2014 Freshman = % of New Fall 2014 Student Projection + % of Fall 2013 Actual Freshman Students + % of New Spring 2014 Actual Students
Start a total enrollment model with an algebraic formula. • Organize your data. (continually changing that) • Who liked High School Algebra? (LB?) • Create a spreadsheet with your data. • To predict the Fall 2014 Total Enrollment from August – December 2013, the first formula: • Projected Fall 2014 Freshman = % of New Fall 2014 Student Projection + % of Fall 2013 Actual Freshman Students + % of New Spring 2014 Student Projection # FR = (L6*L63)+(K25*L55)+(K9*L68)
Next Step in the Forecast • Projected Fall 2014 Sophomores = % of New Fall 2014 Student Projection + % of Fall 2013 Actual Freshman Students + % of Fall 2013 Actual Sophomore Students + % of New Spring 2014 Student Projection # SO = (L6*L64)+(K25*L56)+(K26*L57)+(K9*L69)
Next Step in the Forecast • Projected Fall 2014 Sophomores = % of New Fall 2014 Student Projection + % of Fall 2013 Actual Freshman Students + % of Fall 2013 Actual Sophomore Students + % of New Spring 2014 Student Projection • # SO = (L6*L64)+(K25*L56)+(K26*L57)+(K9*L69) • Projected Fall 2014 Juniors = % of New Fall 2014 Student Projection + % of Fall 2013 Actual Sophomore Students + % of Fall 2013 Actual Junior Students + % of New Spring 2014 Student Projection • # JR = (L6*L65)+(K26*L58)+(K27*L59)+(K9*L70)
Last Step in the Forecast • Projected Fall 2014 Seniors = % of Fall 2013 Actual Junior Students + % of Fall 2013 Actual Senior Students + % of Fall 2014 Student Projections • Projected Fall 2014 Total Enrollment = # FR = (L6*L63)+(K25*L55)+(K9*L68) # SO = (L6*L64)+(K25*L56)+(K26*L57)+(K9*L69) # JR = (L6*L65)+(K26*L58)+(K27*L59)+(K9*L70) # SR = (L4*L59)+(K20*L53)+(K21*L54) Formulas will change depending on when you are making the calculations.
Look for Patterns that will inform other decisions: Actual Fall New Enrollment : What happened 2008? Projected Enrollment change from last year. Compare Actual Freshman Retention and Graduation Rate. Projecting Core Course Needs Projecting Expenses and Housing Needs
Summary Thoughts to Hold On To: • Projections are only as good as your data, and your assumptions.
Summary Thoughts to Hold On To: • Projections are only as good as your data, and your assumptions. • There is still “randomness” to be expected.
Summary Thoughts to Hold On To: • Projections are only as good as your data, and your assumptions. • There is still “randomness” to be expected. • When I am relatively close and have helped provide direction for the college, I thank the Lord and accept the praise I receive!
Summary Thoughts to Hold On To: • Projections are only as good as your data, and your assumptions. • There is still “randomness” to be expected. • When I am relatively close and have helped provide direction for the college, I thank the Lord and accept the praise I receive! • When I am way off and am acknowledged for my good efforts, I remember we are dealing with 18-22 year olds in a period of economic uncertainty and thank the Lord for job security as a Registrar.(unless you can help me come up with a better excuse )