1 / 7

Meteorological charts

Meteorological charts. Station Circle. These symbols summarise a surface met. observation. The circle denotes the position. Pressure is in tenths of mb with the leading 10 or 9 omitted; thus 107 is 1010.7 mb. Temperature is in tenths of a degree, i.e 57 = 5.7 °C.

ozzy
Download Presentation

Meteorological charts

An Image/Link below is provided (as is) to download presentation Download Policy: Content on the Website is provided to you AS IS for your information and personal use and may not be sold / licensed / shared on other websites without getting consent from its author. Content is provided to you AS IS for your information and personal use only. Download presentation by click this link. While downloading, if for some reason you are not able to download a presentation, the publisher may have deleted the file from their server. During download, if you can't get a presentation, the file might be deleted by the publisher.

E N D

Presentation Transcript


  1. Meteorological charts

  2. Station Circle These symbols summarise a surface met. observation. The circle denotes the position. Pressure is in tenths of mb with the leading 10 or 9 omitted; thus 107 is 1010.7 mb. Temperature is in tenths of a degree, i.e 57 = 5.7 °C Wind is in knots – 1 knot = 0.5 ms-1. The arrow points along the wind direction. This symbol is called a wind fleck.

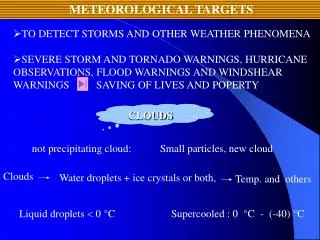
  3. Symbols Clouds Weather

  4. Surface weather chart, 12 Z 16/10/97

  5. 700 mb chart, 16/10/97

  6. 300 mb chart, 16/10/97

  7. Satellite images, 1414, 16/10/97 Infra-red (emitted at 12 µm) Visible (reflected sunlight)

More Related