Download
1 / 5
50 likes | 191 Views
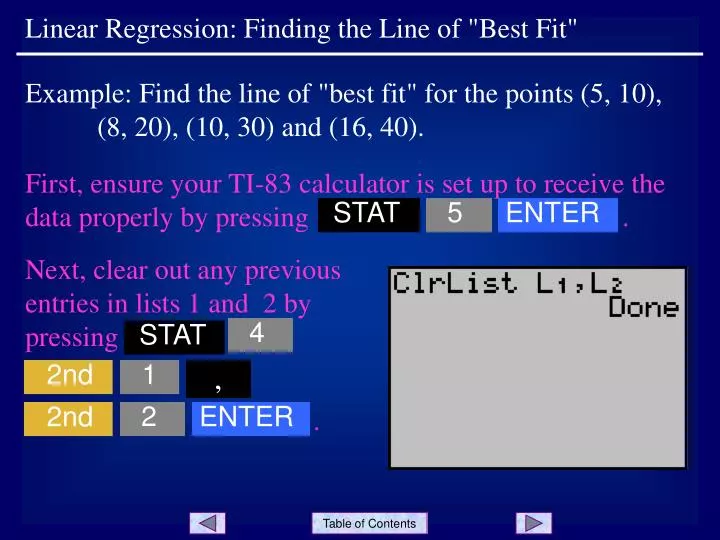
First, ensure your TI-83 calculator is set up to receive the data properly by pressing . STAT. 5. ENTER. Next, clear out any previous entries in lists 1 and 2 by pressing . 4. STAT. 2nd. 1. ,. 2nd. 2. ENTER.

E N D
First, ensure your TI-83 calculator is set up to receive the data properly by pressing . STAT 5 ENTER Next, clear out any previous entries in lists 1 and 2 by pressing . 4 STAT 2nd 1 , 2nd 2 ENTER Linear Regression: Finding the Line of "Best Fit" Example: Find the line of "best fit" for the points (5, 10), (8, 20), (10, 30) and (16, 40).
Now view the screen in which data can be entered by pressing . STAT ENTER Enter each x-coordinate of the data points ((5, 10), (8, 20), (10, 30), (16, 40)) by keying it in and pressing . This puts the data in list 1 (L1). Press to move to the top of list 2 (L2) and enter the y-coordinates of the data points the same way. ENTER Next, press . STAT 4 ENTER Linear Regression: Finding the Line of "Best Fit" Slide 2
Last, press . ENTER Linear Regression: Finding the Line of "Best Fit" On the second line of the screen, you see the linear equation y = ax + b. The values of a and b are listed on the next two lines. Use this to write the approximate equation of the line of "best fit" as y 2.703x – 1.351. Try: Find the line of "best fit" for the points (2, 3), (3, 8), (5, 10) and (6, 13). The line of "best fit" is y= 2.2x – 0.3. Slide 3
Notes: It is not necessary to repeat the first step (pressing ) for each line of "best fit" you find. STAT 5 ENTER Linear Regression: Finding the Line of "Best Fit" The r-value displayed indicates the closeness of the line of best fit. An r-value may range from -1 to 1. It is positive for lines of positive slope and negative for lines of negative slope. If a line of "best fit" with positive slope has an r-value of 0.9, it is a better fit than another line of best fit with an r-value of 0.8 (the closer the r-value is to 1, the better the fit). Similarly, if a line of "best fit" with negative slope has an r-value of - 0.9, it is a better fit than another line of best fit with an r-value of - 0.8 (the closer the r-value is to - 1, the better the fit). Slide 4
Linear Regression: Finding the Line of "Best Fit" END OF PRESENTATION Click to rerun the slideshow.