Download
1 / 42
420 likes | 611 Views
Designing the “Best” Rectangular Warehouse: A Computational Study. Gurdal Ertek, Alp Akcay. 1. 2. Preview. Motivation Definitions Earlier work Results From Literature Research Questions Methodologies Computational Results Insights Conclusions Future Work. 3. Motivation.

E N D
Designing the “Best” Rectangular Warehouse: A Computational Study Gurdal Ertek, Alp Akcay 1
Preview • Motivation • Definitions • Earlier work • Results From Literature • Research Questions • Methodologies • Computational Results • Insights • Conclusions • Future Work 3
Operational Cost Receiving Shipping 10% 20% Storage 15% 55% Order Picking
Order Picking Time Documentation and Other Activities 15% Extracting 15% 50% Traveling 20% Searching
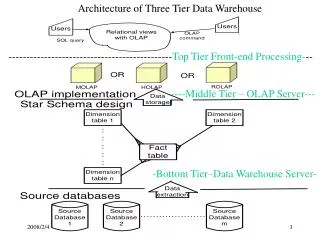
Definitions Rectangular warehouse ...or... independent rectangular zones within a warehouse Picker-to-part system Storage blocks & Aisles between them Cross aisles perpendicular to the main aisles Case 1 vs Case 2
Assumptions • Slower moving items (B&C items) • Uniformly distributed pick locations • Aisle-by-aisle picking policy • Order picker starts and ends at the left bottom corner • Different than Ertek et al. (2007)
B W Cross Aisle 0 L A Cross Aisle 1 1) - Main Aisle M Main Aisle 1 Main Aisle 2 Main Aisle 3 Main Aisle (M Cross Aisle N Cross Aisle N+1 Start Finish Case 1: Equally Spaced Cross-Aisles Notation M:no of main storage blocks N:no of interior cross aisles T:length of pick face on eachmain aisle L:length of each storage block L = T / (N+1) A:width of each cross aisle B:width of each main aisle W:width of each storage block
Earlier Work: V&P • Vaughan, T.S. and Petersen, C.G. (1999) “The effect of warehouse cross-aisles on order picking efficiency”, International Journal of Production Research, vol. 37, no.4, p881-897. • Optimal aisle-by-aisle tour to pick items for Case 1 • Conditions under which cross aisles generate the greatest benefit
Earlier Work: R&dK • Roodbergen, K.J. and De Koster, R. (2001) “Routing methods for warehouses with multiple cross aisles”, International Journal of Production Research, vol. 39, no.9, p1865-1883. • Routing algorithms for Case 1 • Two new heuristic algorithms developed • Comparison of six heuristics (four from literature, including aisle-by-aisle)
Case 2: Unequally Spaced Cross Aisles Cross Aisle 0 L1 1 - M 2 M 3 A Cross Aisle 1 L2 Cross Aisle N LN+1 Cross Aisle N+1 Start Finish
Earlier Results Design only rectangular warehouses with equally spaced cross aisles (consider Case 1, forget about Case 2) Design warehouses with 2 or 3 cross aisles, if the warehouse dimensions and order patterns are not known apriori and if there are less than 5 items per aisle. Reference: Ertek, G., Incel, B. and Arslan, M. C. (2007)"Impact of crossaisles in a rectangular warehouse: A computational study"
Research Questions How does operational efficiency change wrt warehouse area? How does travel distance change wrt warehouse area and items picked? Is there an ideal height / length ratio for a rectangular warehouse?
MethodologiesData Envelopment Analysis (DEA) • Methodology for comparing efficiency of a group of entities • Decision Making Units (DMUs) • Based on optimization modeling • Few assumptions about the units and magnitudes of data • Nonnegative data 18
MethodologiesData Envelopment Analysis (DEA) • Uses data regarding the DMUs • Inputs (Resources consumed) • Outputs (Desired outcomes produced) • Represents the efficiencies of these entities as a single computed value ranging from 0 to 1 • Efficiency scoresof the DMUs • Also returns the reference sets 19
MethodologiesInformation Visualization • Visually understanding data • Detecting important patterns • Coming up with hypotheses • Emergence of Information Visualization • Data mining, computer graphics, human-computer interaction (HCI), explanatory data analysis • New styles of visualizations • Spence (2001) 20
Research Steps Implementing V&P Algorithm in Java within Eclipse Running the simulation experiments in Kubuntu Linux Cleaning the data using Notepad++ Arranging and filtering the data using MS Excel Computing efficiencies using a DEA model in GAMS Visual data analysis using Miner3D
Experimental Settings Consider only the cases with ( Area < 6,000 ) and ( ItemsPicked < 200 )
Model • 19,784 warehouse scenarios included in the DEA model • Inputs • Warehouse Area • Average Travel Distance • Output • Number of ItemsPicked 26
Model • BCC input oriented DEA model • DEA carried out through GAMS • Model developed by Dyson, Thanassoulis, and Boussofiane (1995) • Efficiency scores denote the relative performance of the 19,784 scenarios in the presence of two inputs and one output. 27
Analysis Miner3D www.miner3d.com
Future Research Other warehouse settings Pallet/case picking with forklifts Statistical modelling and curve fitting Implementing other routing algorithms Designing the best warehouse Finding the best mix of rectangular warehouses Impact of facility shapes (I, L, X, H)
References Dyson, Thanassoulis, and Boussofiane (1995) “A DEA Tutorial,” Warwick Business School. Ertek, G., Incel, B. and Arslan, M. C. (2007) "Impact of cross aisles in a rectangular warehouse: A computational study," in Facility Logistics, Editors: Maher Lahmar and Kevin Gue, Taylor & Francis (forthcoming). Roodbergen, K. J., De Koster, R. (2001) “Routing methods for warehouses with multiple cross aisles,” International Journal of Production Research, vol: 39, pp. 1865-1883. Vaughan, T. S., Petersen, C. G. (1999) “The effect of warehouse cross aisles on order picking efficiency,” International Journal of Production Research, vol: 37, pp. 881-897.
Thank you… 42