Download
1 / 46
460 likes | 467 Views
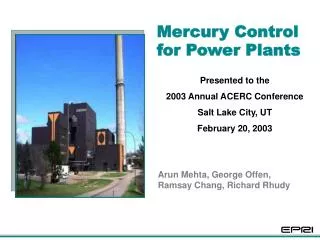
Performance and Costs of Mercury Control Technology for Bituminous Coals. NC DAQ Mercury and CO2 Workshop April 20, 2004 Raleigh, NC. Michael D. Durham, Ph.D., MBA ADA-ES, Inc. 8100 SouthPark Way, Unit B Littleton, CO 80120 (303) 734-1727 miked@adaes.com. Outline.

E N D
Performance and Costs of Mercury Control Technology for Bituminous Coals NC DAQ Mercury and CO2 Workshop April 20, 2004 Raleigh, NC Michael D. Durham, Ph.D., MBAADA-ES, Inc. 8100 SouthPark Way, Unit B Littleton, CO 80120 (303) 734-1727 miked@adaes.com
Outline • Mercury Emissions from Coal Fired Boilers • Background on Control Technology • Sorbent Injection for Controlling Hg Emissions • Costs for Mercury Control • Regulatory Parameters from a Control Device Perspective
ControlsBituminous PM Only CS-ESP 46% HS-ESP 12% FF 83% PM Scrubber 14% Dry FGD SDA + ESP SDA + FF 98% Wet FGD CS-ESP+Wet FGD 81% HS-ESP+Wet FGD 55% FF+Wet FGD 96% Subbituminous 16% 13% 72% 0% 38% 25% 35% 33% Hg Removal with Existing Equipment
Existing Source MACT Limits NOTE: Output-based standards are referenced to a baseline efficiency (35% for new units; 32% for existing units).
Mercury Emissions with Average Capture for Bituminous (46%) and Subbituminous (16%) Coals
Options Available for Reducing Mercury Emissions • Wet Flue Gas Desulfurization (FGD) Scrubbers. • Sorbent Injection. Novel approaches are not considered viable as time from development to market is too long
Control of Mercury in Wet FGD Scrubbers • Oxidized Mercury is water soluble and can be captured in wet scrubbers. • Some captured mercury gets re-emitted. • Elemental mercury cannot be captured by scrubbers.
Mercury Removal in Wet Scrubbers for Bituminous Coals Low correlation of existing data; difficult to predict the mercury removal that will be achieved in a WFGD
Oxidizing Catalysts Wet Scrubber SCR for NOx Electrostatic Coal Precipitator Oxidizing Chemicals Enhancing Capture of Hg in Wet Scrubbers:Increase Amount of Oxidized Hg
Status of Technologies for Oxidizing Mercury • SCRs: • Documenting performance on full-scale installations. • Better performance on bituminous than subbituminous coals. • Possibility of aging effects. • Possibility of interferences from other chemicals. • Catalysts are being designed to reduce oxidation of SO3; this may impact oxidation of Hg. • Oxidizing Catalysts: • Pilot-scale testing under way. • Oxidizing Chemicals: • Some very short-term full-scale tests. • Concerns with corrosion.
Sorbent Injection Mercury Control Technology
Sorbent Injection Hg CEM ESP or FF Ash and Sorbent Coal-Fired Boiler with Sorbent Injection
ADA-ES Hg Control Program: Phase I • Full-scale field testing of sorbent-based mercury control on coal-fired boilers. • Primary funding from DOE National Energy Technology Laboratory (NETL). • Cofunding provided by: • Southern Company; • We Energies; • PG&E NEG; • EPRI; • Ontario Power Generation; • TVA; • FirstEnergy; • Kennecott Energy; and • Arch Coal.
Removal of Mercury Species with PAC on Bituminous Coal Bituminous with FF PARTICULATE OXIDIZED ELEMENTAL TOTAL PAC Injection μg/m3μg/m3μg/m3μg/m3 COHPAC™ Inlet 0.23 6.37 4.59 11.19 COHPAC™ Outlet 0.12 0.91 0.03 1.05 Removal Efficiency 45.6% 85.7% 99.3% 90.6%
Effect of Flue Gas Characteristics • The capacity of sorbents to capture mercury decreases at higher temperatures. • Chlorine and other trace acid gases play a significant role in the performance of PAC.
g HgCl2 /g AC) ( Adsorption Capacity vs. Temperature Equilibrium Adsorption Capacity - Darco FGD 3000 2500 2000 1500 1000 500 0 200 250 300 350 400 450 Temperature (F)
100 90 80 70 ESP Bitum 300F 60 Mercury Removal (%) ESP - Bitum 350F 50 40 30 20 10 0 0 5 10 15 20 25 30 Sorbent Injection Rate (lb/Macf) Hg Capture vs. Temperature (w/ACI)
Equilibrium Adsorption Capacities at 250°F Upstream and Downstream of SO3 Injection
Sorbent Injection Upstream of a Wet Scrubber • Injection of AC and capture in ESP will provide an additional mechanism to reduce mercury emissions. • Oxidation of mercury produced by carbon could enhance capture in FGD. • Decreased mercury levels in scrubber could reduce potential for reemission of elemental mercury from scrubber. • Two DOE/Industry full-scale field tests are scheduled: • Georgia Power Yates; currently on-going, medium-sulfur bituminous coal; and • AEP Conesville; Spring ’05, high-sulfur bituminous.
Ash Issues • The mercury captured by PAC, LOI, and ash appears to be very stable and unlikely to reenter the environment. • The presence of PAC will most likely prevent the sale of ash for use in concrete. • Several developing technologies to address the problem: • Separation • Combustion • Chemical treatment • Non-carbon sorbents • Configuration solutions such as EPRI TOXECON™
Sorbent Injection PJFF Electrostatic Precipitator Coal Fly Ash (1%) + PAC Fly Ash (99%) TOXECON™ Configuration TOXECON™N
Alabama Power E. C. Gaston Unit 3 • 270 MW firing a variety of low-sulfur, washed eastern bituminous coals. • Particulate Collection: • Hot-side ESP;SCA = 274 ft2/kacfm • COHPAC™ baghouse • Wet ash disposal to pond. • Primary funding from DOE/NETL with cofunding provided by: • Southern Company • Duke Energy • Ontario Power Generation • TVA • Kennecott Energy • We Energies • – EPRI • – First Energy • – Hamon Research-Cottrell • – Arch Coal
Phase I Test Results 100 90 80 70 % Hg Removal 60 50 40 30 20 10 0 0 1 2 3 4 5 Injection Concentration (lbs/MMacf)
Year-Long TOXECONTM Test • Conduct ~ 1 year demonstration of TOXECONTM (sorbent injection into COHPAC) for power plant mercury control. • Determine design criteria and costs for new TOXECONTM systems. • Determine balance-of-plant impacts.
Impact of Injection on Performance 4.5 4.0 3.5 3.0 2.5 Average p/b/h 2.0 1.5 1.0 0.5 0.0 0 0.5 1 1.5 2 2.5 3 3.5 4 Injection Concentration (lbs/MMacf)
Phase I Test Results 100 90 80 70 % Hg Removal 60 50 40 30 20 10 0 0 1 2 3 4 5 Injection Concentration (lbs/MMacf)
Low Load/Low Flow Test • Baseline conditions limit injection concentration. • Test plan changed to accommodate real-life conditions. • Current air-to-cloth ratio of 8.0 ft/min is too high for TOXECONTM. • Low load test conducted to simulate operation at air-to-cloth ratio of 6.0 ft/min • APC arranged for 72 hours of operation at low, steady load.
ACI Cost Estimates for Bituminous Coals • Assumptions • 250 MW Plant; 80% Capacity Factor • Capital and Operating Costs for ESP • 50-70% Hg Removal: PAC Injection @ 10 lb/Macf • PAC Injection Equipment: $790,000 • Carbon costs: $2,562,000/yr • Capital and Operating Costs for FF • Add COHPAC Fabric Filter at $50/kW: $12,500,000 • 80-90% Hg Removal: PAC Injection @ 3 lb/Macf • PAC Injection Equipment: $790,000 • Carbon costs: $769,000/yr
Costs of Mercury Control Depend on Plant Size Not on Amount Removed • Costs of mercury control are unrelated to the amount of mercury captured • Sorbent Injection Technology • SCR/FGD • Catalytic Oxidation • Other Developing Technologies
Conclusions on ACI Performance • AC injection can effectively capture elemental and oxidized mercury from bituminous coals. • There will be difference in site to site performance of ACI due to differences in coal, equipment, and flue gas characteristics. • Fabric filters provide better contact between the sorbent and mercury than ESPs, resulting in higher removal levels at lower sorbent costs. • Long-term results are promising showing consistent Hg removal greater than 85%. • New COHPAC™ fabric filters will have to be designed to handle higher loadings of PAC to insure high (>90%) mercury removal.
Commercial Status of Technology • Equipment • Similar equipment has been used successfully in the waste industry to inject AC into flue gas. • It has successfully been scaled up for full-scale utility applications. • Operating continuously for nearly a year at Gaston. • Three AC injections systems currently operating. • Supply of Activated Carbon and Other Sorbents • Sufficient supply available to meet several State regulations. • Additional production needed to meet Federal regulations. • Tremendous progress being made with improved sorbents. • Performance • Will vary with type of equipment (FF vs. ESP). • Will vary from site to site due to flue gas characteristics (temperature, acid gases).
Availability of Activated Carbons Current excess capacity of AC production in Tons/year NORIT Americas: 22,500 Other US Suppliers: 40,000 Total US Excess Capacity 62,500 Donau (Germany) 130,000 CarboChem (China) 60,000 Total Import Excess Capacity 190,000 Total US and Import Excess Capacity 252,500
Number of 250 MW Plants that Can Be Treated by Currently Available AC (out of 1100 in US) Excess Capacity ESPs FF Tons/yr (50-70%) (70-90%) US AC 62,000 30 99 Total US 252,000 120 400 Plus Imports • Manufacturers plan to increase production to meet market demand, but only upon regulatory certainty.
Regulatory Parameters from a Control Device Perspective • Long term averaging • Dual Limit • Removal Efficiency • Emission Limit • Flexibility in Achieving Mercury Removal • Accounts for site by site variation in performance • Enhances cost effectiveness • Mechanism to Encourage Adoption
Long-Term Averaging Time will Allow Control Devices to Adapt to Variations in Coal and Operating Conditions
Decisions on Mercury Control with Flexibility in Achieving Reductions Utilities would have a significant economic incentive to put mercury control on units that are: • Higher emitters • Larger plants Therefore, a flexible approach would result in the greatest reduction in total mercury emissions while minimizing costs
Flexibility Would Provide a Framework for Fleet-wide Decisions on Mercury Control
Flexibility Would Help Address Plant by Plant Variations in Performance Guarantees
Early Adoption of Technology Provides Increased Experience Base • To date, 8 full-scale field tests have been completed through funding from DOE-NETL, EPRI, Utilities, APC Vendors, and Coal Companies. • An additional 12 field tests are planned for the next 2-3 years. • Economic incentives for early compliance are needed to offset risks with new technology. • This will increase the operational data base (different fuels and equipment), decrease uncertainty, solidify guarantees.