Download
1 / 6
60 likes | 145 Views
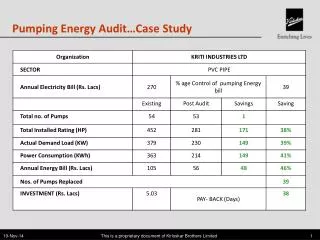
Case Study Managing Aeration Energy Usage ( Analyzing BOD load removal per kilowatt hour). Problem: Energy Costs Must Be Reduced. Problem:

E N D
Case StudyManaging Aeration Energy Usage (Analyzing BOD load removal per kilowatt hour)
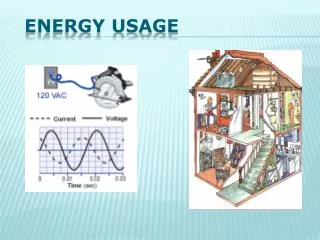
Problem: Energy Costs Must Be Reduced • Problem: • Oxygen transfer efficiency is a function of bubble size. The smaller the bubble, the higher the efficiency. Ceramic or membrane diffusers will foul in time, causing the bubble size to increase which uses more energy to treat the same BOD load. To minimize energy used with minimal downtime, it is important to determine when diffusers need to be cleaned. Symptoms: • Monthly energy bill increasing, over budget year to date • Aeration basin efficiency is down • Inefficient cleaning cycles adding cost
Plan: Analyzing the problem The principles of “Plan-Do-Check-Act” provide sustainable results. Plan: Use WIMS to compare pounds of BOD removed (lab data generated from the Hach HQ430D Benchtop meter with the Intellical LBOD probe) per KW of electricity used (SCADA data) “"The Hach WIMS™ has been instrumental in the collection of relevant data. Its data capture and reporting capabilities have provided us a comprehensive analysis of our projects.” Hach WIMS has fostered analysis beyond regulatory data. Information on pumping stations, energy usage, material usage, and cost analysis are just a few of the trends performed to enhance optimization.”
Do: Identify the Problem WIMS™ shows the cleaning cycle by benchmarking pounds of BOD removed (lab data) per KW of electricity used (SCADA data). Benchmark shows that the diffuser should be cleaned at 2.0lb BOD/kwh Diffuser Cleaning Recommended
Check: Sustainability • Best Management Practices say it is not enough to simply identify the problem and formulate a solution. The solution must be sustainable to gain maximum benefit. • Sustainability: • Continuous monitoring and improvement • via dashboards and email notification • Making data-driven decisions • Open communications Monitoring becomes easy Useful graphs are one click away
Act: Results and Continuous Improvement • Savings Achieved: • Optimized cleaning cycle saves approximately 30% to 50% energy costs • Improved diffuser maintenance and prolonged asset life • More efficient maintenance lowering maintenance cost • Management by exception • Dashboards allow easy monitoring for sustainability • Monitoring Key Performance Indicators provides early warning and allows time for efficient planning • Making Data-Driven Decisions • Remove BOD at designed capacity to ensure regulatory compliance • Data shows optimal cleaning cycles • Data used to communicate more effectively