Download
1 / 42
470 likes | 643 Views
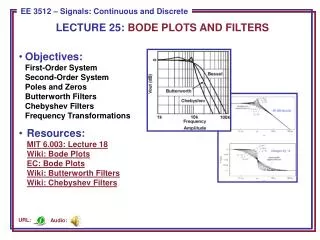
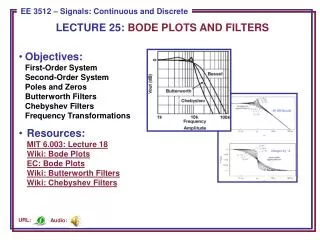
CHAPTER 6 Frequency Response, Bode Plots, and Resonance. State the fundamental concepts of Fourier analysis. 2 . Determine the output of a filter for a given input consisting of sinusoidal components using the filter’s transfer function.

E N D
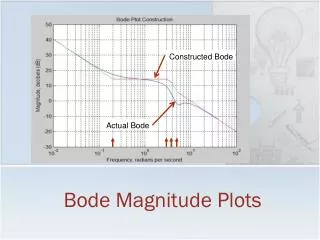
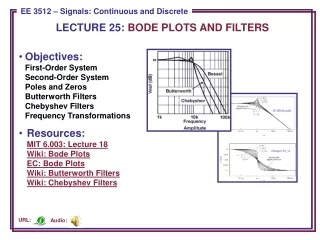
CHAPTER 6Frequency Response, Bode Plots, and Resonance • State the fundamental concepts of Fourier analysis. • 2. Determine the output of a filter for a given input consisting of sinusoidal components using the filter’s transfer function.
3. Use circuit analysis to determine the transfer functions of simple circuits. 4. Draw first-order lowpass or highpass filter circuits and sketch their transfer functions. 5. Understand decibels, logarithmic frequency scales, and Bode plots.
6. Draw the Bode plots for transfer functions of first-order filters.
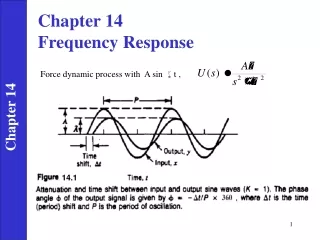
Fourier Analysis All real-world signals are sums of sinusoidal components having various frequencies, amplitudes, and phases.
Filters Filters process the sinusoid components of an input signal differently depending of the frequency of each component. Often, the goal of the filter is to retain the components in certain frequency ranges and to reject components in other ranges.
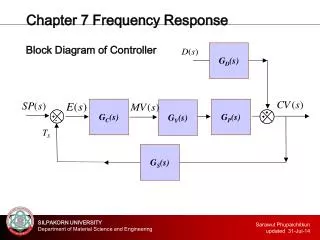
Transfer Functions The transfer function H(f ) of the two-port filter is defined to be the ratio of the phasor output voltage to the phasor input voltage as a function of frequency:
The magnitude of the transfer function shows how the amplitude of each frequency component is affected by the filter. Similarly, the phase of the transfer function shows how the phase of each frequency component is affected by the filter.
Determining the output of a filter for an input with multiple components: 1. Determine the frequency and phasor representation for each input component. 2. Determine the (complex) value of the transfer function for each component.
3. Obtain the phasor for each output component by multiplying the phasor for each input component by the corresponding transfer-function value. 4. Convert the phasors for the output components into time functions of various frequencies. Add these time functions to produce the output.
Linear circuits behave as if they: • Separate the input signal into components having various frequencies. • 2. Alter the amplitude and phase of each component depending on its frequency. • 3. Add the altered components to produce the output signal.
FIRST-ORDER LOWPASS FILTERS
DECIBELS, THE CASCADE CONNECTION, AND LOGARITHMIC FREQUENCY SCALES
Logarithmic Frequency Scales On a logarithmic scale, the variable is multiplied by a given factor for equal increments of length along the axis.
A decade is a range of frequencies for which the ratio of the highest frequency to the lowest is 10. An octave is a two-to-one change in frequency.
Conversion of Signals from Analog to Digital Form If a signal contains no components with frequencies higher than fH, the signal can be exactly reconstructed from its samples, provided that the sampling rate fsis selected to be more than twice fH.