Download
1 / 113
1.14k likes | 1.32k Views
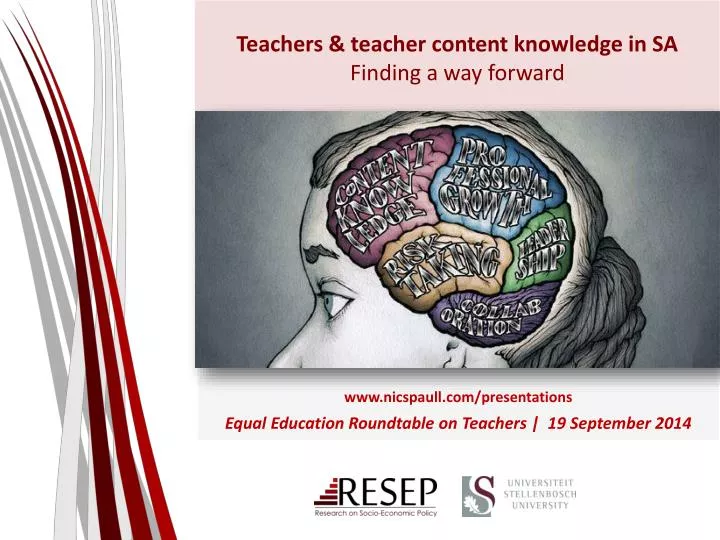
Teachers & teacher content knowledge in SA Finding a way forward. www.nicspaull.com /presentations Equal Education Roundtable on Teachers | 19 September 2014. Outline. An axiomatic approach to talking about teachers Framing: The SA education system Focusing on teachers

E N D
Teachers & teacher content knowledge in SAFinding a way forward www.nicspaull.com/presentations Equal Education Roundtable on Teachers | 19 September 2014
Outline • An axiomatic approach to talking about teachers • Framing: The SA education system • Focusing on teachers • Teacher content knowledge • Teacher training (esp in-service teacher training) • The need to differentiate • Some thoughts on the way forward
An axiomatic approach:Teachers exist because we care about learning • The teaching profession does not have an independent reason to exist (i.e. independent of students learning). • It should not exist ‘for its own sake’ • It is not an employment agency. • It is not a voting bloc for hire. • It serves a function and gains legitimacy by serving that function. • It exists because we care about learning/education and teachers are an essential & integral part of learning/education. • Given the above the correct thing to focus on when discussing teachers is studentlearning – how do we improve and increase the ‘quality’ of what students learn and ‘volume’ of what they learn. • Schooling is essentially about (1) the student, and (2) the teacher in the presence of (3) content. (ala Elmore 2008) • In all of our discussions around teachers we must keep in mind that the end goal is the STUDENT, not the teacher (although the teacher is often an ‘intermediate end-goal’, but not final end-goal). #perspective
Bimodality – indisputable fact PIRLS/ TIMSS/ SACMEQ/ NSES/ ANA/ Matric… by Wealth/ Language/ Location/ Dept…
Labour Market • University/FET • Type of institution (FET or University) • Quality of institution • Type of qualification(diploma, degree etc.) • Field of study (Engineering, Arts etc.) • High productivity jobs and incomes (17%) • Mainly professional, managerial & skilled jobs • Requires graduates, good quality matric or good vocational skills • Historically mainly white High quality secondaryschool Unequal society High SES background +ECD High quality primary school Minority (20%) Some motivated, lucky or talented students make the transition • Vocational training • Affirmative action • Big demand for good schools despite fees • Some scholarships/bursaries Majority (80%) Quality Type Attainment Low quality secondary school • Low productivity jobs & incomes • Often manual or low skill jobs • Limited or low quality education • Minimum wage can exceed productivity Low SES background Low quality primary school cf. Servaas van der Berg – QLFS 2011
Overview of education in SA • 12.4m students • 4 % of students are in independent schools (i.e. 96% public) • 25,826 schools • 6% of schools are independent schools (i.e. 94% public) • 425,000 teachers • 8% of teachers are in independent schools (i.e. 92% public) • Near universal access up to Grade 9 (quality?!)
From an expenditure point of view it makes sense to look at teachers (3-5% GDP) Expenditure on education2010/11 Government exp on education (19.5% of Gov exp: R143.1bn) Total government expenditure (31% GDP in 2010/11 – R733.5bn) 17% 5%
Looking at primary school maths teachers (Gr 6) specifically…
Teacher content knowledge • Taylor & Vinjevold(1999, p. 230)summarize the 54 studies that made up this initiative and conclude as follows:“The most definite point of convergence across the [President’s Education Initiative] studies is the conclusion that teachers’ poor conceptual knowledge of the subjects they are teaching is a fundamental constraint on the quality of teaching and learning activities, and consequently on the quality of learning outcomes.” • Carnoy & Chisholm (2008, p.33): “The relatively low level of mathematics knowledge that teachers have in all somewhat troubling. It raises some doubts about the preparation of the teacher forcebutthe highest student [socioeconomic status] schools is”. • Taylor & Taylor (2013, p. 230): “The subject knowledge base of the majority of South African grade 6 mathematics teachers is simply inadequate to provide learners with a principled understanding of the discipline…providing teachers with a deep conceptual understanding of their subject should be the main focus for both pre- and in-service teacher training”.
New (2014) research on mathematics teacher content knowledge • Using SACMEQ 2007 teacher test, Venkat & Spaull classify the 42 items in the SACMEQ maths teacher test according to content strand and grade level • 9 items at Gr4/5 level • 19 items at Gr6/7 level • 14 items at Gr 8/9 level • Classify teachers based on grade-level using a 60% minimum mark requirement for threshold • Less than grade 4/5 content knowledge • Grades 4 & 5 content knowledge • Grades 4, 5, 6 ,7 content knowledge • Grades 4, 5, 6, 7, 8 and 9 content knowledge *Given that the test items were structured in MCQ format all responses were corrected using Frary’s correction formula
Forthcoming work on primary school mathematics teachers in SA (Spaull & Venkat, 2014) Figure 1: Proportion of South African grade 6 mathematics teachers by content knowledge (CK) group - SACMEQ 2007 (with 95% confidence interval) [401 Gr6 maths teachers]
Primary school mathematics teachers in SA (Venkat & Spaull, 2014) Figure 4: Average percentage correct on all 42 items in SACMEQ 2007 mathematics teacher test by quintile of school socioeconomic status and school location (corrected for guessing) [401 Gr6 maths teachers]
Primary school mathematics teachers in SA (Venkat & Spaull, 2014) Figure 5: Proportion of Grade 6 mathematics teachers by CK grouping and quintile of school socioeconomic status (SACMEQ 2007) - with 95% confidence intervals [401 Gr6 maths teachers]
Teacher knowledge Teachers cannot teach what they do not know. Demonizing teachers is popular, but unhelpful • “For every increment of performance I demand from you, I have an equal responsibility to provide you with the capacity to meet that expectation. Likewise, for every investment you make in my skill and knowledge, I have a reciprocal responsibility to demonstrate some new increment in performance” (Elmore, 2004b, p. 93).
IN-servicevs PRE-service teacher training/development • Don’t focus only, or primarily, on initial teacher-ed (cue opposition from the folk in ed-faculties ) • You cannot improve the quality of teaching unless we somehow improve the quality of existing teachers and existing teaching practices • Useful to think about STOCKvsFLOW of teachers…
‘Stock’ vs ‘Flow’ of teachers in SA • 29 994 people got some kind of education qualification from a higher education institution in 2013 • (includes undergraduate diploma or certificate, general academic bachelor’s degree, professional first bachelor’s degree, post-graduate diploma or certificate, national certificate, national higher certificate, national diploma, higher certificate, diploma) • Martin Gustafsson estimated that 19 100 qualified educators joined the education system annually between 2005 and 2008 • New teachers (B.Ed) • New teachers (PGCE) • New teachers (foreigners) • New teachers (unregistered) 5% In 2012 there were 425,167 teachers (Education Statistics 2012, p4) If we don’t crack the issue of in-service teacher development in the next 20 years (i.e. providing existing teachers with meaningful learning opportunities) we are basically “screwed” • Teachers retiring • Teachers moving into other professions • Teachers immigrating • Teachers dying
(1b) Find substance and reject form • If we want to make headway with teacher development (which is in everyone’s interests) we need to be basing interventions on reliable evidence NOT on politics or fads or what looks good on paper • Nothing is properly evaluated. Evaluation is always an after-thought in education. Imagine if we used the same logic in health “This treatment for cancer looks great on paper, let’s do it”, “This homeopathic remedy worked for my cousin’s daughter so let’s roll it out to the whole country” • We currently don’t know what works when it comes to in-service teacher training programs. Maybe we know what works in those 5 schools with that one inspirational manager and those few academics in that one circuit, but no one knows what works at anything like scale (circuit+). No one. Not the academics (educationists or economists), not the NGOs, not DBE, not the unions, not GPLMS, not LITNUM, not Pearson, not NEEDU. No one.
(1b) Commitment to substance not form • Evaluation is key – unless we are evaluating what we are doing we don’t know if it works. We are scattering bricks in a room as opposed to building a wall. We should only ever take things to scale IF they have been evaluated and shown to be effective in various settings and at various scales (alaBorko). • Identify master-teachers – To improve the quality of teachers currently in schools we need a small army of high-quality teacher-trainers (GPLMS?). • We have to find a way of identifying master-teachers and create the institutional frameworks to give them time and incentives to develop programs that help teachers. • There are brilliant teachers in all different types of schools but we currently have no idea who they are or where they are • Serves the dual purpose of giving prestige (and benefits) to excellent teachers AND they are our best bet if getting out of the quagmire (not academics or NGOs or government) “Let a thousand flowers bloom”
(2) Need to be more nuanced when talking about “teachers”There are large inter-provincial and inter-quintile differences in school practices…but also intra-province and intra-quintile differences need to differentiate
School practices • How often do you send pupils home when the teacher is absent? (SACMEQ 3) (S Taylor, 2011)
School practices • How often do you leave pupils on their own when the teacher is absent? (SACMEQ 3) (S Taylor, 2011)
School practices • How often do you substitute an absent teacher with a qualified teacher? (SACMEQ 3) (S Taylor, 2011)
Teacher absenteeismSACMEQ III (2007) • What is the distribution of teacher (self-reported) absenteeism across school SES quintiles? • See 2010 HSCR report on Khulisa Consortium Audit data Mondays and Fridays and 1-2 day leave instances make up vast majority
(2) Averages are uniquely misleading in SA • Talking about “South African teachers” isn’t that meaningful/helpful and in many instances is downright misleading • Irrespective of your views about differential teacher pay we have a serious need for differentiating between teachers (in discussion, in the media, in analysis). • To attract competent people into the profession these individuals need to be able to identify with a desirable sub-set of the teacher core. • Hearts-and-minds campaign celebrating excellent/passionate/intelligent/ dedicated/self-sacrificial/empathetic/motivational teachers and differentiating them from a tainted minority. This CANNOT be a model-C vs non-model-C categorization. We have some excellent teachers in rural areas and Q1-3 schools which we should identify and hold them up as shining examples of what it means to be a teacher. • We need to isolate and stigmatize “bad practices” rather than stigmatizing “teachers in general” which is the status quo • These bad practices might be widespread (absenteeism, shirking etc.), or rare (rape, abuse, corruption) and in both instances we need to consistently differentiate and avoid statements like “teachers are incompetent” or “teachers are professional” – some teachers ARE incompetent but not all, and some teachers are professional but not all. We may disagree on whether we are talking about 5%, 10% or 40% but we don’t mean 100% and we don’t mean 0% can we PLEASE get away from talking about absolutes. False dichotomies help politicians not kids.
What does the way forward look like? What are the tangible things that we all (and specifically EE) can do going forward regarding teachers and teaching? • Find substance and reject form in teacher training • Differentiate between teachers • Hearts and minds campaign • Everyone needs to come to the table and play ball can’t afford to keep going with the stalemate that we have (no DG for 2 years?! WTF?)
Thank youComments?This presentation and papers available online at:www.nicspaull.com/research
Language and province (Analysis by Martin Gustafsson using ASS) This should also make us cautious about extrapolating the findings of GPLMS to other provinces
Possible solution… • The DBE cannot afford to be idealistic in its implementation of teacher training and testing • Aspirational planning approach: All primary school mathematics teachers should be able to pass the matric mathematics exam (benchmark = desirable teacher CK) • Realistic approach: (e.g.) minimum proficiency benchmark where teachers have to achieve at least 90% in the ANA of the grades in which they teach, and 70% in Grade 9 ANA (benchmark = basic teacher CK) • First we need to figure out what works! • Pilot the system with one district. Imperative to evaluate which teacher training option (of hundreds) works best in urban/rural for example. Rigorous impact evaluations are needed before selecting a program and then rolling it out • Tests are primarily for diagnostic purposes not punitive purposes
Current situation RE teacher development • Currently there are no in-service training programs that have been rigorously evaluated and shown to improve mathematics teacher content knowledge, at least not at any scale (circuit or higher). • This is one of the SCANDALS of higher education post-apartheid • Although there are many small NGO initiatives, most are not evaluated and it is unclear if the training: • Actually works (does what it intends to do) • changes classroom behavior, • improves student learning • Is scalable from capacity, cost and/or program-design perspectives
What can unions do going forward? See Borko, H. (2004) Professional development and teacher learning: Mapping the terrain. Educational Researcher, 33(8), 3-15.
What can unions do going forward? Main contribution of unions. Identify master-teachers from existing members, provide time and resources to develop teacher-training programs See Borko, H. (2004) Professional development and teacher learning: Mapping the terrain. Educational Researcher, 33(8), 3-15.
Accountability: teacher absenteeism(SACMEQ III – 2007 – 996 teachers) 4th/15
Accountability: teacher absenteeism(SACMEQ III – 2007 – 996 teachers) Yes, BUT…2007 was a bad year 15th/15
Accountability: teacher absenteeism • Teacher absenteeism is regularly found to be an issue in many studies • 2007: SACMEQ III conducted – 20 days average in 2007 (Spaull, 2011) • 2008: Khulisa Consortium audit – HSRC (2010) estimates that 20-24 days of regular instructional time were lost due to leave in 2008 • 2010: “An estimated 20 teaching days per teacher were lost during the 2010 teachers’ strike” (DBE, 2011: 18) • Importantly this does not include time lost where teachers were at school but not teaching scheduled lessons • A recent study observing 58 schools in the North West concluded that “Teachers did not teach 60% of the lessos they were scheduled to teach in North West” (Carnoy & Chisholm et al, 2012)
Accountability: teacher absenteeism(SACMEQ III – 2007 – 996 teachers) Limpopo KwaZulu-Natal Eastern Cape Western Cape % absent > 1 week striking 97% 81% 32% 82% % absent > 1 month(20 days) 48% 62% 22% 73% 12% % absent > 2 months(40 days) 0% 10% 5% 1.3 days a week
Outline • Overview of the SA education system • State of education since the transition • Overview of teacher union membership in SA • Teacher content knowledge in South Africa • What is the role of school management in addressing the problem? • Conclusion
Things to discuss? Teacher CK Teacher unions Teacher training (in & pre) Civil service capacity Resources Access vs Quality Grade R / ECD Accountability & Capacity LOLT Student performance Teacher absenteeism Learning deficits
Things to discuss? Teacher CK Teacher unions Teacher training (in & pre) Civil service capacity Resources Access vs Quality Grade R / ECD Accountability& Capacity LOLT Student performance Teacher absenteeism Learning deficits
(1) An overview of the South African education system
State of SA education since transition • “Although 99.7% of South African children are in school…the outcomes in education are abysmal” (Manuel, 2011) • “Without ambiguity or the possibility of misinterpretation, the pieces together reveal the predicament of South African primary education” (Fleisch, 2008: 2) • “Our researchers found that what students know and can do is dismal” (Taylor & Vinjevold, 1999) • “It is not an overstatement to say that South African education is in crisis.” (Van der Berg & Spaull, 2011)
Student performance 2003-2011 TIMSS (2003) PIRLS (2006) SACMEQ (2007) prePIRLS(2011) TIMSS (2011) TIMSS 2003 (Gr8 Maths & Science) • Out of 50 participating countries (including 6 African countries) SA came last • Only 10% reached low international benchmark • No improvement from TIMSS 1999-TIMSS 2003 • See Reddy et al (2006) PIRLS 2006(Gr 4/5 – Reading) • Out of 45 participating countries SA came last • 87% of gr4 and 78% of Gr 5 learners deemed to be “at serious risk of not learning to read” • See Howie et al. (2006) SACMEQ III 2007(Gr6 – Reading & Maths) • SA came 10/15 for reading and 8/15 for maths behind countries such as Swaziland, Kenya and Tanzania • See Moloi & Chetty (2010) & Spaull (2012) TIMSS 2011(Gr9 – Maths & Science) • SA has joint lowest performance of 42 countries • Improvement by 1.5 grade levels (2003-2011) • 76% of grade nine students in 2011 still had not acquired a basic understanding about whole numbers, decimals, operations or basic graphs, and this is at the improved level of performance • See Reddy et al. (2012) & Spaull (2013) prePIRLS2011 (Gr 4 Reading) • 29% of SA Gr4 learners completely illiterate (cannot decode text in any langauge) • See Howie et al (2012) • NSES 2007/8/9 • Gr 3/4/5 • See Taylor, Van der Berg & Mabogoane (2013) • Systemic Evaluations 2007 • Gr 3/6 • Matric exams • Gr 12
“But what does this low & unequal performance look like in practice, on the ground, in the classroom?”
NSES question 42NSESfollowed about 15000 students (266 schools) and tested them in Grade 3 (2007), Grade 4 (2008) and Grade 5 (2009). Grade 3 maths curriculum: “Can perform calculations using appropriate symbols to solve problems involving: division of at least 2-digit by 1-digit numbers” Even at the end of Grade 5 most (55%+) quintile 1-4 students cannot answer this simple Grade-3-level problem. “The powerful notions of ratio, rate and proportion are built upon the simpler concepts of whole number, multiplication and division, fraction and rational number, and are themselves the precursors to the development of yet more complex concepts such as triangle similarity, trigonometry, gradient and calculus” (Taylor & Reddi, 2013: 194) (Spaull & Viljoen, 2014)
Insurmountable learning deficits: 0.3 SD Spaull & Viljoen, 2014 (SAHRC Report)
550,000 students drop out before matric • 99% do not get a non-matric qualification (Gustafsson, 2011: p11) • What happens to them? 50% youth unemployment…
(2) Mathematics content knowledge of SA teachers
Background: Data SACMEQ • Southern and Eastern African Consortium for Monitoring Educational Quality • 14 participating countries • SACMEQ II (2000), SACMEQ III (2007) • Nationally representative • Testing : • Gr 6 Numeracy • Gr 6 Literacy • HIV/AIDS Health knowledge SACMEQ III: South Africa • 9071 SA Grade 6 students • 498 SA Grade 6 math teachers • 392 SA primary schools • See SACMEQ website for research