Download
1 / 52
530 likes | 657 Views
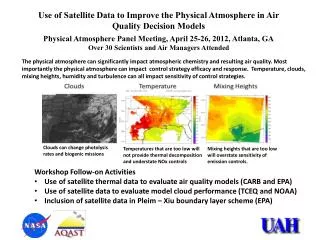
Use of Satellite Data to Improve the Physical Atmosphere in Air Quality Decision Models AQAST Project Physical Atmosphere Panel Meeting April 25-26, 2012 Atlanta, GA Richard McNider Arastoo Pour Biazar (or Arastoo McBiazar ) University of Alabama in Huntsville.

E N D
Use of Satellite Data to Improve the Physical Atmosphere in Air Quality Decision Models AQAST Project Physical Atmosphere Panel Meeting April 25-26, 2012 Atlanta, GA Richard McNider Arastoo Pour Biazar (or ArastooMcBiazar) University of Alabama in Huntsville
Physical Atmosphere Advisory Team • Wayne Angevine- NOAA – Boundary Layer Observations • Bright Dornblauser– State of Texas – Regulator Model Evaluation • Mike Ek/Jeff McQueen – NOAA – Land Surface Modeling • Georg Grell – NOAA – Clouds and Modeling • John Nielsen-Gammon – Texas A&M – Model Evaluation • Brian Lamb – Washington State University – Emissions/ Model Evaluation • Pius Lee – NOAA – Air Resources Laboratory – Air Quality Forecasting • Jon Pleim– US EPA – Boundary Layer Modeling • Nelsen Seaman – Penn State University – Meteorological Modeling • SaffettTanrikulu - SF Bay Area Air Quality District – Meteorological Modeling
Also had participation from Local and Regional Air Quality Community in and around Atlanta Brenda Johnson – EPA Region IV Richard Monteith – EPA Region IV Steve Mueller – Tennessee Valley Authority Justin Walters – Southern Company Jim Boylan – Georgia Environmental Protection Division Tao Zeng - Georgia Environmental Protection Division Lacy Brent – Discovery AQ/U. Maryland KiranAlapaty – EPA-NERL Jim Szykman- EPA- NERL Ted Russell - Georgia Tech TalatOdman – Georgia Tech Maudood Khan – University Space Research Association Scot t Goodrick – U.S. Forest Service
Physical Atmosphere Can Significantly Impact Atmospheric Chemistry and Resulting Air Quality Most Importantly the Physical Atmosphere Can Impact Control Strategy Efficacy and Response Temperature, Clouds, Mixing Heights, Humidity and Turbulence Can All Impact Air Quality Clouds Temperature Mixing Heights Satellite Observation
AGENDA AQAST PHYSICAL ATMOSPHERE MEETING April 25-26, Atlanta Georgia April 25 12:30 PM Lunch 2:00 PM Introductions 2:15 PM Background and Charge – Dick McNider 2:45 PM Physical Issues and Shortcomings in Physical Atmosphere Modeling for SIP or Forecasting (10-15 minute presentations) General Nelson Seaman SaffetTanrikulu James Boylan Scott Goodrick Wayne Angevine 4:00 Break
4:15 Physical Issues and Shortcomings in Physical Atmosphere Modeling for SIP or Forecasting (continued) General Pius Lee Bright Dornblauser Jeff McQueen Steve Mueller Lacey Brent (Discovery AQ) Maudood Khan Clouds and Photolysis ArastooBiazar KiranAlapaty 6:00 PM Recap and Adjourn 6:30 -8:30 PM Reception
April 26 8:00AM -8:30AM Continental Breakfast 8:30 AM Physical Issues and Shortcomings in Physical Atmosphere Modeling for SIP or Forecasting (continued) Land Surface –PBL - Emissions Jon Pleim John Nielsen-Gammon Ted Russell Brian Lamb 9:30 AM Discussion of Use of Satellite Information to Improve the Physical Atmosphere Overview – Dick McNider Land Surface – Jon Pleim, Jeff McQueen, Maudood Khan Clouds and Photolysis– ArastooBiazar, KiranAlapaty, SaffetTanrikulu Winds – Bill Murphrey/ Dick McNider/Seaman 10:30 AM Break
10:45 AM Discussion of Use of Satellite Information to Improve the Physical Atmosphere General ( Participation by all) 12:00 NOON Lunch 1:00 PM Selection of Priorities – Lead (Dick McNider) Participation by All 2:00 PM Formation of Application Paths and Team Formation 3:00 PM Recap and Adjourn
The presentations by both members of the panel and by local participants brought up a wide variety of topics • Coastal clouds in California • Nighttime Mixing in Houston and Atlanta • Winds for forest fire smoke transport in Georgia • Snow cover in Spring in West (photolysis and land surface energetics) • Tropospheric/Stratospheric exchange for background ozone in the Pacific Northwest • Topographic effects on 8 hour standards • Urban/Rural bias in NO2 which may be related to physical atmosphere in Mid-Atlantic • Representativeness of SIP Meteorology in Georgia
Categorization Summary Clouds for Photolysis, Vertical Mixing and Aqueous Chemistry ‐ Angevine, Tanrikulu, Biazar, Alapaty, Boylan Stable Boundary Layer for Vertical Mixing, Winds, Cold Pooling - Seaman, Boylan, Lee, Russell, Lamb Land Surface for Fluxes and Deposition - Angevine, DornBluaser, Pleim, Tanrikulu, Lee Windsfor Transport and Dilution - Dornblaser, Lee, Odman Mixing Heights for Dilution and Plume Rise - McQueen, Goodrick Topography – Seaman, Mueller, Lamb Snow Cover for Land Surface and Photolysis ‐ Tanrikulu Tropospheric/Stratospheric Exchange for Ozone Background - Lamb, Biazar
Potential For Use of Satellite Data For Improvement and/or Verification Clouds for Photolysis, Vertical Mixing and Aqueous Chemistry ‐ Angevine, Tanrikulu, Biazar, Alapaty, Boylan - VERY HIGH Stable Boundary Layer for Vertical Mixing, Winds, Cold Pooling - Seaman, Boylan, Lee, Russell, Lamb - MODERATE Land Surface for Fluxes and Deposition - Angevine, DornBluaser, Pleim, Tanrikulu, Lee - HIGH Windsfor Transport and Dilution - Dornblauser, Lee, Odman – MODERATE Mixing Heights for Dilution and Plume Rise - McQueen, Goodrick – LOW/MODERATE Topography – Seaman, Mueller, Lamb - LOW Snow Cover for Land Surface and Photolysis ‐ TanrikuluVERY HIGH Tropospheric/Stratospheric Exchange for Ozone Background - Lamb, Biazar – MODERATE/HIGH
Based on Importance to Physical Atmosphere and Potential for Use of Satellite Data Selected Three Major Themes Clouds Stable Boundary Layer 3. Land Surface
James Boylan Time series O3 Mon Tue Wed Thur Fri Sat Sun O3
Modified Kzz 9525 1/2 Clinton Dr 9525 1/2 Clinton Dr Date (July 2006 CDT) Date (July 2006 CDT) Russell-Odman Ozone in Houston Original Kzz 8-h Ozone Concentration (ppm) Driven by reanalysis of nocturnal boundary layer mixing
Texas – Dornblaser – Lee Stable regime Model deficiency: mismatch in night time decoupling? regional average surface wind speed for period June 4 – 12 (dark color) and June 26 – July 3 (light color). Frequent surface wind-speed high-bias Night time high wind-speed bias Occurred repeatedly for many days right after sunset Similarity theory for surface layer; e.g. Ulrike Pechinger et al. COST 710, 1997
Russell-Odman 1-h Ozone Concentration Original Kzz Modified Kzz
Ramifications Ted Russell • Significantly changes model performance • Less effect on peak ozone • Still non-zero • Major effect on primary/pseudo-primary species concentrations • EC, CO, NO2, PM2.5 • New standards raise importance of NO2. • Use of models in health effects research raise importance of bias, diurnal variation
Cold pool modeling Brian Lamb from Avey, Utah DEQ) Routine application of prognostic meteorological models including the Fifth-Generation NCAR/Penn State Mesoscale Model (MM5) and Weather Research and Forecasting Model (WRF) with a variety of different physics options, initialization input, vertical and horizontal resolutions, and nudging approaches have failed to replicate the degree and persistence of stagnant meteorological conditions. (Baker et al., 2011, ES&T). • AIRPACT Forecasts don’t capture elevated wintertime PM2.5 levels • stagnant valley meteorology • woodstove emissions
Sub-Km Modeling of the Stable Boundary Layer Combined modeling and observation studies Nittany Valley, Central PA Observation Network WRF smallest domain (0.444 km horizontal resolution) 10 km scale
a) 0500-0700 UTC b) 0600-0800 UTC c) 0700-0900 UTC Sub-Km Modeling of the Stable Boundary Layer Releases at one-hour intervals from Site 9 at 5 m AGL d) 0500-0700 UTC e) 0600-0800 UTC f) 0700-0900 UTC Tussey Ridge
Path Forward Explore mixing formulations for stable boundary layer and role of resolution with MODIS skin temperatures as evaluation metric. Fh(Ri) Coarse grid models Theory Ri
GOES Derived Skin Temperature MODIS Derived Skin Temperature
Steve Mueller Nocturnal boundary layer formation dependent on topography has implications for 8 hour attainment at high elevations.
Wayne Angevine Cloud Mixing Changes Effective PBL Height CO profiles from P3 upwind, over, and downwind of Nashville (symbols) Tracer profile from 1D cloud-aware PBL model (early version of TEMF) Lower panel shows what happens when cloud-induced mixing is not present CO profiles from P3 upwind, over, and downwind of Nashville (symbols) Tracer profile from 1D cloud-aware PBL model (early version of TEMF) Lower panel shows what happens when cloud-induced mixing is not present
KiranAlapaty Surface Insolation Diff: (KFC-BASE) W/m^2 10X10 cells Over RDU Southeast Land cells
Tests in Texas showed changes in cloud locations and radiative properties can change ozone by 70ppb
It Rains Cats & Dogs in a Clear Sky!!! (for convective clouds in WRF) KiranAlapaty Radiative effects were not included for WRF subgrid scale clouds.
Inconsistency in Cloud Handling in Models MM5/WRF do not consider sub-grid clouds in radiation calculations. Clouds in MM5/WRF not used in CMAQ (clouds rediagnosed) for wet chemistry mixing. CMAQ photolysis rates not based on CMAQ clouds but on MM5/WRF liquid water profiles. These inconsistencies make correction difficult!
Satellite data can be used as a metric to test model cloud agreement
Path Forward Insert satellite measures of radiative properties directly in models. Use satellite derived measures of insolation based on satellite clouds rather than modeled insolation using model clouds (McNider et al. 1995) Use satellite cloud transmittance in photolysis calculations (Biazar et al. 2007) Improve physical parameterizations using satellite data as performance metric Correct model radiation (Alapaty et al. 2012) Connect PBL and cloud schemes (Angevine 2012) Assimilate satellite data to improve the location and timing of cloud Provide dynamical cloud support and cloud clearing (McNider and Biazar 2012)
Factors controlling surface temperatures are complex and many models have created complex land use models that in the end require many ill defined parameters.
Land surface Top-level soil temperature and moisture BLLAST, 30 June 2011, 14Z
Air Quality Simulations for SIPs Are Retrospective Studies Allows use of observations to constrain forecast models Simple Surface Models Constrained by Observations PleimXiu Scheme McNider et al. 1994 / Norman et al. 1995 (ALEXI)
Pleim-Xiu - Land surface energy budget Soil moisture
Soil Moisture Nudging Nudge according to model bias in 2-m T and RH compared to surface air analysis
T-2m bias relative to analysis for January 2006 Qv-2m bias relative to analysis for January 2006
Mean bias for 2m T – August 2006 12km domain: Most around -1 to +1 Positive bias: N and W regions Negative bias: S, E 1km: Most Negative within -0.5 Negative bias: high along the coast 4km: Most around: -0.5 to +0.5 Negative bias: high along the coast
McNider et al. 1995 Surface Energy Budget Bulk Heat Capacity Evaporative Heat Flux Short-wave radiation obtained from Satellite Morning Evening
Satellite Data Can Provide Many More Opportunities for Data Skin Temperature Assimilation (GOES ~5 km and MODIS ~1 km). Land characteristics especially in Eastern U.S. fine scale variations. Satellite Observation Assimilation Control
Model BL Heights (ASSIMALATED) Aug. 26, 2000, 19:00-21:00 GMT averaged Model BL Heights (CNTRL) Aug. 26, 2000, 19:00-21:00 GMT averaged
Path Forward Use satellite skin temperatures in Pleim –Xiu scheme rather than National Weather Service 2 m temperatures Test McNider et al. scheme using new corrections (use of model skin temperatures and aerodynamic temperatures) suggested by Mackaro
Pleim-Xiu - Land surface energy budget Use satellite derived albedo and insolation Soil moisture