Download
1 / 1
10 likes | 106 Views
Comparison of Near-Surface Flows Assessed by Ring-Diagram and F-Mode Time-Distance Analyses. ABSTRACT

E N D
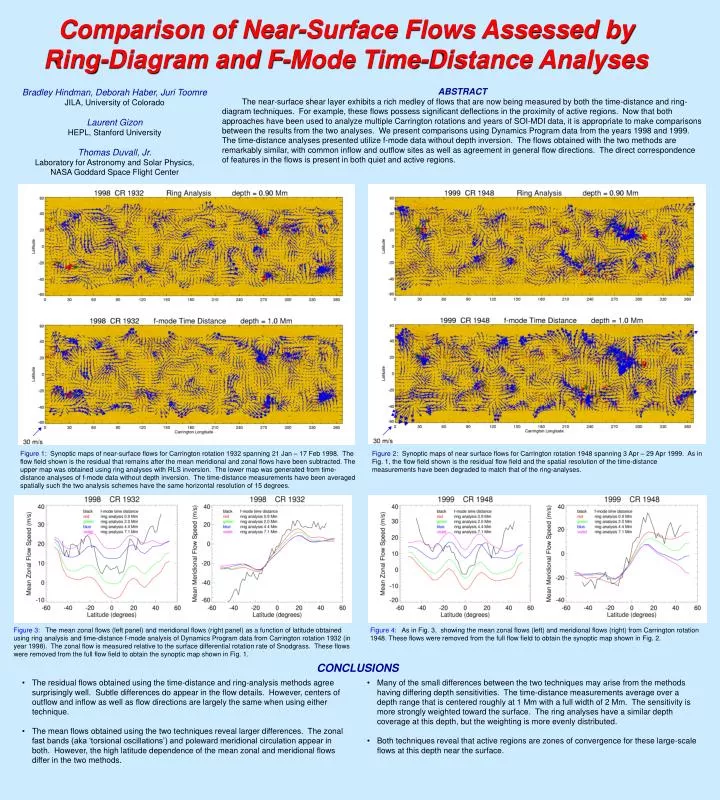
Comparison of Near-Surface Flows Assessed by Ring-Diagram and F-Mode Time-Distance Analyses ABSTRACT The near-surface shear layer exhibits a rich medley of flows that are now being measured by both the time-distance and ring-diagram techniques. For example, these flows possess significant deflections in the proximity of active regions. Now that both approaches have been used to analyze multiple Carrington rotations and years of SOI-MDI data, it is appropriate to make comparisons between the results from the two analyses. We present comparisons using Dynamics Program data from the years 1998 and 1999. The time-distance analyses presented utilize f-mode data without depth inversion. The flows obtained with the two methods are remarkably similar, with common inflow and outflow sites as well as agreement in general flow directions. The direct correspondence of features in the flows is present in both quiet and active regions. Bradley Hindman, Deborah Haber, Juri Toomre JILA, University of Colorado Laurent Gizon HEPL, Stanford University Thomas Duvall, Jr. Laboratory for Astronomy and Solar Physics, NASA Goddard Space Flight Center Figure 1: Synoptic maps of near-surface flows for Carrington rotation 1932 spanning 21 Jan – 17 Feb 1998. The flow field shown is the residual that remains after the mean meridional and zonal flows have been subtracted. The upper map was obtained using ring analyses with RLS inversion. The lower map was generated from time-distance analyses of f-mode data without depth inversion. The time-distance measurements have been averaged spatially such the two analysis schemes have the same horizontal resolution of 15 degrees. Figure 2: Synoptic maps of near surface flows for Carrington rotation 1948 spanning 3 Apr – 29 Apr 1999. As in Fig. 1, the flow field shown is the residual flow field and the spatial resolution of the time-distance measurements have been degraded to match that of the ring-analyses. Figure 3: The mean zonal flows (left panel) and meridional flows (right panel) as a function of latitude obtained using ring analysis and time-distance f-mode analysis of Dynamics Program data from Carrington rotation 1932 (in year 1998). The zonal flow is measured relative to the surface differential rotation rate of Snodgrass. These flows were removed from the full flow field to obtain the synoptic map shown in Fig. 1. Figure 4: As in Fig. 3, showing the mean zonal flows (left) and meridional flows (right) from Carrington rotation 1948. These flows were removed from the full flow field to obtain the synoptic map shown in Fig. 2. CONCLUSIONS • The residual flows obtained using the time-distance and ring-analysis methods agree surprisingly well. Subtle differences do appear in the flow details. However, centers of outflow and inflow as well as flow directions are largely the same when using either technique. • The mean flows obtained using the two techniques reveal larger differences. The zonal fast bands (aka ‘torsional oscillations’) and poleward meridional circulation appear in both. However, the high latitude dependence of the mean zonal and meridional flows differ in the two methods. • Many of the small differences between the two techniques may arise from the methods having differing depth sensitivities. The time-distance measurements average over a depth range that is centered roughly at 1 Mm with a full width of 2 Mm. The sensitivity is more strongly weighted toward the surface. The ring analyses have a similar depth coverage at this depth, but the weighting is more evenly distributed. • Both techniques reveal that active regions are zones of convergence for these large-scale flows at this depth near the surface.