Download
1 / 43
470 likes | 745 Views
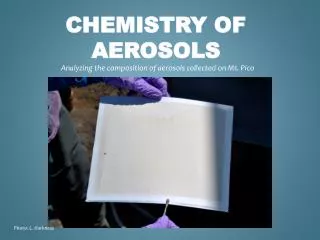
Aerosols. What is the mean diameter of the particles?". The answer to this question changes with your point of view. What size particles carry the most mass? (Biogeochemical cycles) What size particles cover the largest surface area? (visibility)

E N D
What is the mean diameter of the particles?" The answer to this question changes with your point of view. What size particles carry the most mass? (Biogeochemical cycles) What size particles cover the largest surface area? (visibility) What is the size of the most abundant particles?(cloud microphysics)
Aerosol Distributions Number cloud formation Surface visibility Volume mass Mass & Number human health
Number distribution function • The number of particles with diameter between Dp and Dp + dDp in a cm3 fn(Dp) dDp (particles cm-3/mm) • The total number of particles, N: N =fn(Dp) dDp (particles cm-3 )
Surface Area Distribution Function The surface area of particles in a size range per cm3 of air fs(Dp)dDp = pDp2 fn(Dp ) (mm2mm-1cm-3 The total surface area of the particles, S, is given by the integral over all diameters: S= fs(Dp) dDp = p Dp2 fn (Dp) dDp(mm2 cm-3)
Volume Distribution Function The Volume distribution function can be defined fv (Dp) dDp = {p/6} Dp3fn (Dp) (mm3mm-1 cm-3 ) So the total volume occupied can be written V = fv(Dp) dDp = p/6 Dp3 fn(Dp) dDp (mm3 cm-3)
Log Normal Distributions based on log Dp can be defined n(log Dp)dlogDp is the number of particles in one cm3 with diameter from Dp to Dp +log Dp. The total number is: N= n(log Dp)d(logDp) (particles cm-3 ) n (log Dp)={dN} / {NdlogDp } ns (log Dp)={dS} / {SdlogDp } nv (log Dp)={dV} / {VdlogDp } This is the common notation for expressing the variation in particle number, surface area or volume with the log of the diameter.
Distributions which look like Gaussian distributions (“normal” distributions) when plotted with a logarithmic x-axis are called lognormal This size distribution has 2 lognormal modes
TYPICAL U.S. AEROSOL SIZE DISTRIBUTIONS Fresh urban Aged urban rural remote Warneck [1999]
SAMPLE AEROSOL SIZE DISTRIBUTION (MARINE AIR) Sea salt Sulfate (natural)
Aerosols: Visibility Washington, DC
Light Extinction DI/I=e(-bDX) DX I0 I scattering absorption scattering Intensity b (in a few more slides) Extinction Coefficient
EPA REGIONAL HAZE RULE: FEDERAL CLASS I AREAS TO RETURN TO “NATURAL” VISIBILITY LEVELS BY 2064 …will require essentially total elimination of anthropogenic aerosols! moderately polluted day clean day Acadia National Park http://www.hazecam.net/
Atmospheric Visibility(absorption & scattering) 1.Residual 2.Scattered away 3.Scattered into 4.Airlight
Extinction Coefficient bext = bgas +bparticles bext = babs +bscatt babs (gases) = Beer's Law absorption bscatt (gases) =Rayleigh Scattering babs (particles) = Usually< 10% of extinction bscatt (particles) =Mie Scattering=(bsp)
Visibility • The ultimate limit in a very clean atmosphere is Rayleigh scattering • Mie scattering usually dominates. • The range of bsp is 10-5m -1 to 10-3m-1.
Single scattering albedo • w is a measure of the fraction of aerosol extinction caused by scattering: w = bsp/(bsp + bap)
Optical Properties of Small Particles m = n + ik m = complex index of refraction n = scattering (real part) k = absorption (imaginary part) The real part of the index of refraction is only a weak function of wavelength, while the imaginary part, ik, depends strongly on wavelength.
Scattering Cross Section The scattering cross section is the product of the mass loading, and the surface area per unit mass; note the ln of 0.02 is about -3.9, thus Visibility ≈3.9(bsp)-1 bsp = Sm Where bsp is the scattering coefficient in units of m-1 m is the mass loading in units of g m-3 S is the surface area per unit mass in units of m2g-1 For sulfate particles, S is about 3.2 m2 g-1 where the humidity is less than about 70%; for other materials it can be greater. Visibility =3.9/(3.2 m) =1.2 /(m)
Example: Visibility improvement during the 2003 North American Blackout Normal conditions over Eastern US during an air pollution episode: bsp≈ 120 Mm-1 = 1.2 x 10⁻⁴ m-1 at 550 nm bap = 0.8 x 10⁻⁵ m-1 bext = 1.28 x 10⁻⁴ m-1 Visual Range ≈ 3.9/bext = 30 km During blackout bsp = 40 Mm-1 = 0.4 x 10⁻⁴ m-1 bap = 1.2 x 10⁻⁵ m-1 bext = 0.52 x 10⁻⁴ m-1 Visual Range = 3.9/bext = 75 km
Example: Visibility improvement during the 2003 North American Blackout Single scattering albedo, w, normal = 1.20/1.28 = 0.94 Blackout = 0.4/0.52 = 0.77 With the sulfate from power plants missing, and the soot from diesel engines remaining the visual range is up, but the single scattering albedo is down. Ozone production inhibited. See: Marufu et al., Geophys Res. Lett., 2004.
Extinction Coefficient as a PM2.5 Surrogate PM2.5 = 7.6 g/m3 PM2.5 = 21.7 g/m3 PM2.5 = 65.3 g/m3 Glacier National Park images are adapted from Malm, An Introduction to Visibility (1999) http://webcam.srs.fs.fed.us/intropdf.htm
ANNUAL MEAN PARTICULATE MATTER (PM) CONCENTRATIONS AT U.S. SITES, 1995-2000NARSTO PM Assessment, 2003 PM10 (particles > 10 mm) PM2.5 (particles > 2.5 mm) Red circles indicate violations of national air quality standard: 50 mg m-3 for PM10 15 mg m-3 for PM2.5
AEROSOL OPTICAL DEPTH (GLOBAL MODEL) Annual mean
AEROSOL OBSERVATIONS FROM SPACE Biomass fire haze in central America (4/30/03) Fire locations in red Modis.gsfc.nasa.gov
BLACK CARBON EMISSIONS DIESEL DOMESTIC COAL BURNING BIOMASS BURNING Chin et al. [2000]
RADIATIVE FORCING OF CLIMATE 1750-PRESENT IPCC [2001] “Kyoto also failed to address two major pollutants that have an impact on warming: black soot and tropospheric ozone. Both are proven health hazards. Reducing both would not only address climate change, but also dramatically improve people's health.” (George W. Bush, June 11 2001 Rose Garden speech)
ASIAN DUST INFLUENCE IN UNITED STATESDust observations from U.S. IMPROVE network April 16, 2001 Asian dust in western U.S. April 22, 2001 Asian dust in southeastern U.S. 0 2 4 6 8 mg m-3 Glen Canyon, AZ April 16, 2001: Asian dust! Clear day
TRANSPACIFIC TRANSPORT OF ASIAN DUST PLUMES ALTITUDE (km) 100E 150E 150W 100W LONGITUDE GEOS-CHEM Longitude cross-section at 40N, 16 April, 2001 Subsidence over western U.S. Source region (inner Asia) Asian plumes over Pacific 10 5 0 ASIA UNITED STATES T.D. Fairlie, Harvard
Aerosols in the Atmosphere: Abundance and size Aerosol concentration is highly variable in space and time. Concentrations are usually highest near the ground and near sources. A concentration of 105 cm-3 is typical of polluted air near the ground, but values may range from 2 orders of magnitude higher in very polluted regions to several lower in very clean air. Radii range from ~ 10-7 cm for the for small ions to more than 10 µm (10-3 cm) for the largest salt and dust particles. Small ions play almost no role in atmospheric condensation because of the very high supersaturations required for condensation. The largest particles, however, are only able to remain airborne for a limited time
Condensation and sublimation of of vapors and the formation of smokes in natural and man-made combustion. Reactions between trace gases in the atmosphere through the action of heat, radiation, or humidity. The mechanical disruption and dispersal of matter at the earth’s surface, either as sea spray over the oceans, or as mineral dusts over the continents. 4. Coagulation of nuclei which tends to produce larger particles of mixed constitution Summary:Origins of Atmospheric Aerosols
Cloud Condensation Nuclei - CCN Comprises a small fraction of the total aerosol population Sea salt is the predominant constituent of CCN with D > 1µm For 0.1 µm < D < 1 µm, the main component is thought to be sulfate, which may be present as sulfuric acid, ammonium sulfate, or from phytoplankton produced dimethylsulfide (see Charlson et al., Nature, 326, 655-661).
INDOEX, 1999 INDOEX: Indian Ocean Experiment 37
Mean Aerosol Optical Depth over INDOEX region from Dec 2001 to May 2003 from MODIS (Ramanathan & Ramana, Environ. Managers, Dec. 2003). INDOEX +RV Ronald Brown 38
INDOEX 39 0 to 3 km layer From Ramanathan 2001
Field data showing the high variability of aerosol light absorption coefficient with latitude and longitude, measured by NOAA/PMEL scientists aboard the NOAA Research Vessel Ron Brown during the Aerosols 99 and INDOEX (Indian Ocean Experiment) cruises. The aerosol light absorption coefficient is presented in all figures in units of Mm-1. Measurements are made at a wavelength of 550nm. (Courtesy of P.Quinn and T. Bates, NOAA/PMEL.) 42
Summary of Aerosol Physics How big are atmospheric particles depends on which effect interests you. CCN – number (r < 0.1 mm) Radiative transfer & health – surface area (0.1 < r < 1.0 mm) Biogeochemical cycles – mass (r > 0.5 mm). Composition varies with size. Single scattering albedo and visibility