Download
1 / 14
160 likes | 395 Views
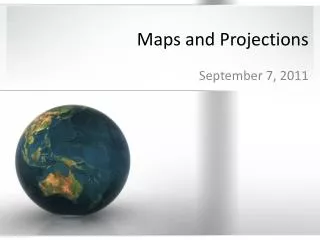
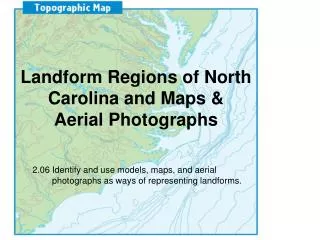
Maps and Regions. Physical Maps. Physical maps show the natural features of the Earth. Physical maps do not contain man made features . For example, a physical map would be a map of what you would see if you were looking down on Earth from space.

E N D
Physical Maps • Physical maps show the natural features of the Earth. • Physical maps do not contain man made features. • For example, a physical map would be a map of what you would see if you were looking down on Earth from space.
When you look at this map, what do you see? Notice you do not see country borders or city markings. These divisions are created by people. For example, there is no actual line dividing Texas from its bordering states. Although some astronauts (with the use of binoculars believe it or not) are able to see roads, large ocean tankers, and even the Great Pyramids from space, at very high altitudes, none of these are visible and all you are left with are natural land formations.
Creating a Physical Map Landforms can be represented with variation of color or symbols Elevations and topography are represented with variation of color. Common symbols- - Volcano -Plain - Mountain -Ocean -River
Political Maps • Unlike physical maps, political maps show how humans have impacted the landscape. For example, city names, roads, country borders, etc. are all part of political maps. • Political maps change frequently (physical maps change very, very slowly through geologic processes) and must be redrawn often. A political map of the world that is 50 years old is no longer accurate. • Wars and ethnic conflict are two major causes political maps change.
Creating a Political Map All neighboring regions should be shaded a different color or the borders must be a different color. This is how borders are identified. All regions identified must be labeled. All waters should be the same blue. Usually land areas are not blue. As always a map needs a legend. Common symbols Capital --------- Boundary City Boundary
Thematic Maps • Thematic maps can represent a variety of information including things like climate, precipitation, vegetation, elevation, population, life expectancy, etc. • Thematic maps are generally used when you are looking at a single piece of information.
Region- How are places similar or different? • An area of the earth’s surface with similar characteristics • Physical, political, economic, cultural 3 Types of Regions Formal Functional Perceptual
Formal Regions • They have a limited number of related characteristics • They may have climate, physical area, economic conditions, or political views that unify them Ex. East Texas Southwest Asia Mississippi River Valley
Functional Regions • They are organized around a set of interactions and connections between places Ex. A city and its suburbs, the metro system, Port of Houston
Perceptual Regions • People see the characteristics of the region as the same Ex. South Texas Midwest