Download
1 / 17
170 likes | 294 Views
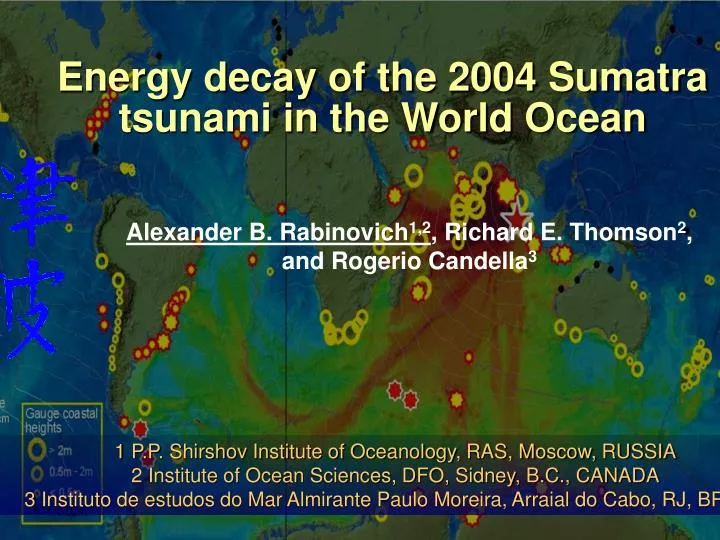
Energy decay of the 2004 Sumatra tsunami in the World Ocean. Alexander B. Rabinovich 1,2 , Richard E. Thomson 2 , and Rogerio Candella 3. 1 P.P. Shirshov Institute of Oceanology, RAS, Moscow, RUSSIA 2 Institute of Ocean Sciences, DFO, Sidney, B.C., CANADA

E N D
Energy decay of the 2004 Sumatra tsunami in the World Ocean Alexander B. Rabinovich1,2, Richard E. Thomson2, and Rogerio Candella3 1 P.P. Shirshov Institute of Oceanology, RAS, Moscow, RUSSIA 2 Institute of Ocean Sciences, DFO, Sidney, B.C., CANADA 3 Instituto de estudos do Mar Almirante Paulo Moreira, Arraial do Cabo, RJ, BRAZIL
Up-to-now knowledge and conceptions Munk [1963]: “…Tsunami energy in the ocean decays in the same manner as sound intensity in a closed room (“acoustic analog model’)” E(t) = E0e-dt, t > td E0is the tsunami index; t0= d-1is the “decay (e-folding) time”; tdis the “diffusion period” (required for tsunami waves to become isotropic).
Munk [1963], Van Dorn [1984, 1987]: “…Main energy losses are associated with absorption during multiple coastal reflections at a rate of ~e-1 per reflection”. t0~tr= L*/VgH L*is the mean free travel pass. Van Dorn [1984, 1987]: Pacific Ocean (1946, 1952, 1957, 1960, 1964) 22 hrs; Indian Ocean (1960) 14.6 hrs; Atlantic Ocean (1960) 13.3 hrs; Sea of Japan (1983) 8.6 hrs. However, Oh and Rabinovich [1994]: Sea of Japan (1993) 3.1 – 13.3 hrs (probably depending on Q-factors of the respective sites)
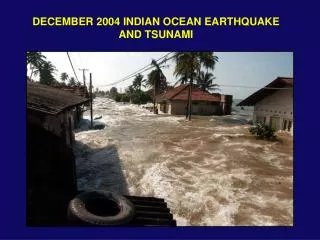
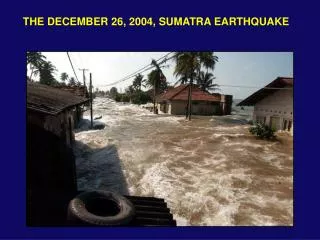
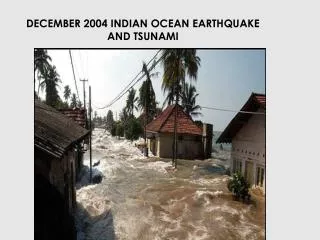
Tsunami of the December 26, 2004 recorded in the World Ocean
Observational data • Indian and South Atlantic Ocean: 50 stations • (2) North Atlantic Ocean: 5 stations • (3) Pacific Ocean: ~40 stations • (4) Deep-ocean stations (NE Pacific): 4 stations Quality records were selected with high signal/noise ratio.
Tsunami records and energy decay Examples Variances were estimated based 6-hour segments with 3-hour shifts
Table 1. Tsunami characteristics estimated from 55 tide gauge records from the Indian and South Atlantic oceans (island stations are written in italics). t is the sampling rate for the gauge. Table 1. Tsunami characteristics estimated for the Indian Ocean
Decay time as function of the travel time Coastal stations Island stations
Pacific Ocean Station Hmax(cm) t0(hrs) Ttsu(hrs) Easter Island (Chile) 39 27.0 15:27 Juan Fernandez I. (Chile) 8 32.3 20:05 San Felix Island (Chile) 12 41.3 21:43 Antofagasta (Chile) 26 26.0 26:51 Arica (Chile) 72 28.7 27:15 Callao (Peru) 67 25.7 25:15 Manzanillo (Mexico) 89 17.8 32:25 Cabo San Lucas (Mexico) 23 11.1 34:30 San Diego (CA, USA) 32 38.6 35:44 Port San Luis (CA, USA) 53 34.2 35:23 Point Reyes (CA, USA) 40 24.6 34:34 Crescent City (CA, USA) 61 26.9 ? Pago Pago (US Samoa) 15 42.5 27:00 Nawiliwili (HI, USA) 14 43.5 ?
Energy decay in the Pacific Ocean Decay time: t0 = 50-54 hrs
Main results: (1) The principal finding of our analysis is the non-uniformity of the decay time. This result contradicts Munk [1963] and Van Dorn [1984, 1987] who determined that the tsunami decay time depends only on morphometric characteristics of the basin (mean depth and lateral dimension), and is therefore fairly uniform within each basin. (2) The observed decay time in general increases with distance and tsunami travel time. The travel time is a key parameter determining the decay time. The greater the distance, the longer the travel time and the greater the degree of “tsunami forcing” by incoming tsunami wave energy.
(3) The ocean shelf effectively absorbs the tsunami energy; the wider and shallower the shelf the more intensive it absorbs and accumulates the tsunami energy. Parameters of shelves play the principal role in the rate of the tsunami energy decay.
In general, our analysis for the 2004 Sumatra tsunami illustrates, the energy decay of major tsunamis is a much slower and more complicated process than previously reported. Large-scale topographic irregularities apparently play a principle role in this process with mid-ocean ridges serving as wave-guides that efficiently transmit tsunami energy from the source area to remote regions of the World Ocean. Continental shelves subsequently have the ability to retain tsunami energy leading protracted tsunami ringing along the coast.