Download
1 / 41
410 likes | 567 Views
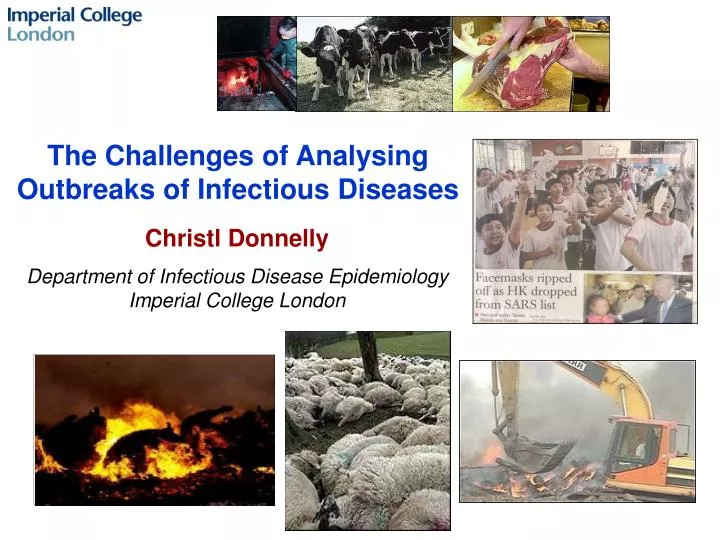
The Challenges of Analysing Outbreaks of Infectious Diseases. Christl Donnelly Department of Infectious Disease Epidemiology Imperial College London. Context. Revolution in data availability for public health planning: Population/demography Disease surveillance

E N D
The Challenges of Analysing Outbreaks of Infectious Diseases Christl Donnelly Department of Infectious Disease EpidemiologyImperial College London
Context • Revolution in data availability for public health planning: • Population/demography • Disease surveillance • Molecular/genetic (for disease and people) • Models integrate data into conceptual framework to: • Interpret pattern • Understand mechanisms • Predict trends • Dual role for modelling and analysis: • Disease control (e.g. FMD, Influenza, SARS, Polio, bovine TB, HIV…). • Basic science – increasing understanding.
Why are infectious diseases different? The risk of my getting infected depends on the risk (and thus the risk behaviour) of others! For example, a person can become HIV-infected from a single sexual contact with a single lifetime partner. Whereas an IV drug user who shares needles within a closed user community will not become infected if all members of that community remain uninfected. 3
Epidemiological modelling The spread of infectious diseases is typically modelled as a function of potential transmission links between individual people / animals / cells or groups such as households or farms. The disease system is described using precisely defined equations. These equations are then used to obtain predictions that can be compared with observed data. • Both biological • infectiousness • duration of symptoms • and non-biological • time from symptoms until treatment • number of individuals in a typical family • components of the disease system are incorporated into a model. from report of FMD until farm slaughter
Insights into transmission: Opportunities for control • Epidemiological models can be used to identify risk factors of disease such as • injecting drug use for HIV, • use of cattle feed containing meat and bonemeal for BSE, and • highly fragmented farm structure for FMD. • These results can be used to identify high-risk populations and points in the infection-transmission cycle that might be targeted by intervention measures. • By modelling possible intervention measures, predictions can also be obtained for the effects of different control options prior to implementation. Relative transmission risk for farms, averaged over 5-km squares, incorporating farm fragmentation data. (Ferguson, Donnelly & Anderson, Nature 2001) 6
Science and evidence-based policy • Despite growing acceptance of evidence-based medicine/healthcare paradigm, basing public policy on firm scientific evidence is still relatively uncommon. • Need to promote public understanding and acceptance that scientific evidence as critical to: • informing policy makers and stakeholders, • demonstrating the potential benefits/risks of policy changes, • highlighting uncertainties in the potential policy impacts • Key to gaining public trust are openness and promotion of public understanding of science. 7
What does a simple outbreak model show about contact tracing and quarantining? Example mini-outbreak Asymptomatic Symptomatic 2 Increasing infectiousness 8
What does a simple outbreak model show about contact tracing and quarantining? Example mini-outbreak Asymptomatic Symptomatic 5 3 Increasing infectiousness 4 9
What does a simple outbreak model show about contact tracing and quarantining? Example mini-outbreak Asymptomatic Symptomatic 2 1 3 Increasing infectiousness 4 10
Impact of self isolation augmented by contact tracing (and quarantine) 90% SI 90% SI + 100% CT 11
Real-time analysis: tools and priorities • Much more data are available immediate for analysis • For example, considerable demographic data are available • Increasingly systematic approaches to data collection reduce biases and missing values • Real-time requirements: • To identify the few simplifying assumptions that may considerably speed-up inference; • To reduce the dimension of the data as much as possible (reduction in computational time); • To design fast and efficient algorithms; • To address biases arising from censoring. 12
SARS Timeline • 16 Nov 02 – The first case of an atypical pneumonia is reported in the Guangdong province in southern China. • 26 Feb 03 – First cases of unusual pneumonia reported in Hanoi, Vietnam. • 10 Mar 03 – Dr Carlo Urbani reports an unusual outbreak of the illness he calls sudden acute respiratory syndrome (SARS) to the main office of the WHO. He notes that the disease has infected an usually high number of healthcare workers (22) at the hospital. • 11 Mar 03 – A similar outbreak of a mysterious respiratory disease is reported among healthcare workers in Hong Kong. • 12 Mar 03 – WHO issues a global alert about a new infectious disease of unknown origin in both Vietnam and Hong Kong. • 15 Mar 03 – WHO issues a heightened global health alert about the mysterious pneumonia with a case definition of SARS as after cases in Singapore and Canada are also identified. International travel advisories issued by WHO and CDC. 14
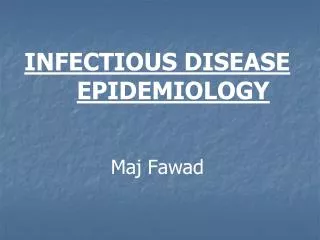
Probable SARS Cases in Hong Kong: 2003 Worldwide 8096 cases – 774 deaths China 5327 cases – 349 deaths Hong Kong 1755 cases – 299 deaths 15
Detected secondary cases Secondary cases not yet detected Censoring – A key statistical challenge If not corrected for… • Case fatality rate could be underestimated (because cases with longer times from infection to death won’t have died yet) • The incubation period could be underestimated (because cases with longer times from infection to diagnosis/recording in the database are less likely to have been recorded). • Onward transmission could be underestimated Considerable pressure for clear, definitive results immediately! Today Primary case Time Infectiousness period 16
Time from symptoms to identification / hospital admission Important to minimise this interval since symptomatic individuals may be transmitting infection on to close contacts Significant shortening of mean duration observed over the course of the epidemic 17
Patients may remain in hospital for several weeks Outcome (death / survival) not known for many patients Therefore early in the epidemic a large proportion of observations are censored Real-time Estimation of the Case Fatality Rate • Method 1: • Method 2: D = Number of deaths C = Total number of cases D = Number of deaths R = Number recovered 18
Adapted Kaplan-Meier Method Two terminal states with hazard functions h0(t) and h1(t) and associated (incomplete) survivor functions: The estimate of the case fatality rate is then: where Estimate the hazard function in discrete time (days) using the simple estimator: where dij is the number of events of type i on day j and nj is the number remaining at risk at time j 19
Adapted Kaplan-Meier Method To extrapolate incomplete survivor functions, assume that death/discharge rate at the tail occurs at the same rate as previously: 20
Impact on WHO methods Donnelly CA, Ghani AC, Leung GM, et al. Epidemiological determinants of the spread of the causal agent of severe acute respiratory syndrome in Hong Kong. Lancet 361: 1761-6, 2003. Online 7 May 03. “WHO Update 49 - SARS case fatality ratio, incubation period 7 May 03 Case fatality ratioWHO has today revised its initial estimates of the case fatality ratio of SARS. … On the basis of more detailed and complete data, and more reliable methods, WHO now estimates that the case fatality ratio of SARS ranges from 0% to 50% depending on the age group affected, with an overall estimate of case fatality of 14% to 15%. … A more accurate and unbiased estimation of case fatality for SARS can be obtained with a third method, survival analysis. This method relies on detailed individual data on the time from illness onset to death or full recovery, or time since illness onset for current cases. Using this method, WHO estimates that the case fatality ratio is 14% in Singapore and 15% in Hong Kong.” 21
Post-epidemic Evaluation of Case Fatality Rate Estimators 22 Source: Ghani et al., American Journal of Epidemiology 162: 479-486, 2005.
Y=1 t=1 Y=2 t=2 Y=4 t=3 Y=8 t=4 Reproduction number R of an epidemic • Epidemics spread through contact (between individuals or farms) • ‘Chain reaction’ gives exponential growth until epidemic begins to run out of susceptible individuals/farms to infect. 8 7 6 5 Y 4 3 2 1 0 1 2 3 4 t • R is the number of secondary infections caused by one primary case at the start of an epidemic. • Needs to be >1 for an epidemic to take off. 23
Transmission Model Reproduced the Observed Dynamics Reproductive number in HK Average of 1000 model simulations Riley S, Fraser C, Donnelly CA et al. Transmission dynamics of the etiological agent of SARS in Hong Kong: Impact of public health interventions. Science 300: 1961-6, 2003. Online 23 May 03. 24
Déirdre FMD Timeline (2001) • 19 Feb (1st case) – Veterinarian at Essex abattoir reports suspected FMD in 27 sows and 1 boar. Livestock movements prohibited within 8km of the infected premises. • 23 Feb (6 cases) – Case identified in Heddon-on-the-Wall [first outside Essex]. From 5pm no movements of FMD-susceptible animals until 2 March*; fairs and markets closed; deer and fox hunting and hare coursing prohibited. • 26 Feb – Neil Ferguson emailed John Wilesmith (VLA Epidemiology Department) regarding epidemiological analysis of FMD epidemic. • 6 Mar (80 cases) – Meeting chaired by John Krebs re: potential for epidemiological analysis to inform control and eradication efforts. Attendees from Imperial College London, Edinburgh, Cambridge and Warwick. MAFF invited to send representatives to the meeting, but were unable to do so due to the demands of FMD control. • 13 March (199 cases) – Epidemiological data emailed by John Wilesmith (VLA Epidemiology Department). 25 *After this some movements to slaughterhouse are allowed.
FMD Geographic spread and daily incidence BBC 26
" 49 - 145 " 33 - 48 " Cows and sheep 20 - 32 " Sheep only 9 - 19 " 1 - 8 Pigs etc. Cows only Farm demography No. of farmsper 5x5 km 27
5 CDG 4 nonCDG GB 3 mean delay (days) 2 1 0 Mar 1-10 Feb Mar Mar Mar Mar 16-20 11-15 21-25 19-28 26-30 day of report Report-slaughter delay distribution The potentially avoidable risks of transmission after infection has been reported but before the farm has been slaughtered are cause for concern, but these delays are decreasing. 28
Pair correlation transmission model Equations somewhat tedious, even for simplified form of model: d[S]/dt=-(t+m+w)[SI]-pb[S][I]/N d[E]/dt= pb[S][I]/N +t[SI]-n[E]-m[EI] d[I]/dt=n[E]-s[I]-m[II] d[SS]/dt=-2(t+m+w)[SSI]-2pb[SS][I]/N d[SE]/dt=t([SSI]-[ISE])-m([SEI]+[ISE])-w[ISE]+pb([SS]-[SE])[I]/N d[SI]/dt=n[SE]-(t+m+w)([ISI]+[SI])- pb[SI][I]/N d[EE]/dt=t[ISE]-2m[EEI]-2n[EE]+ 2pb[SE][I]/N d[EI]/dt=n[EE]-m([EI]+[IEI])-(n+s)[EI]+ pb[SI][I]/N d[II]/dt=2n[EI]-2s[II]-2m([II]+[III]). 29
Predictions as released by OST Ferguson NM, Donnelly CA and Anderson RM. The foot-and-mouth epidemic in Great Britain: Pattern of spread and impact of interventions. Science 292: 1155-60, 2001. Online 12 Apr 01. Predictions as made using data up to 29 March. 31
Choices of statistical methods • Very sophisticated (e.g. data augmentation methods)… • Can estimate sophisticated transmission models (space, relative susceptibility/infectivity according to the type of farm, number of animals…); • Can deal with most of the uncertainties to be found in field data • Main limitation: difficult to implement/update, computational time; • … or relatively simple (e.g. back-calculation type methods): • Easy to implement /fast; • Principle: • To reconstruct the transmission tree; • Then, estimating R is just a matter of counting secondary cases in the tree; • Main limitation: only provide estimates of R (nothing on space, susceptibility and infectiousness variation according to type…) • We developed an EM algorithm: • Model the daily probability of transmission between 2 farms; • EM algorithm: inference based on the comparison of • Number of transmission events predicted by the model; • Number of transmission events occurring in the epidemic; Ferguson NM, Donnelly CA and Anderson RM. Nature 413: 542-8, [4 Oct] 2001. 32
Randomised Badger Culling Trial (RBCT) Three treatments: Proactive culling Reactive culling Survey-only Trial areas were recruited in sets of three, known as triplets. The ten triplets have been denoted A through J. The first triplet to be proactively culled was Triplet B (Dec 1998). The last triplet to begin proactive culling was Triplet D (Dec 2002). Thereafter proactive culls happened roughly annually. 33
The impact of reactive culling on cattle TB incidence The reactive treatment was associated with a 27% increase in the incidence of cattle TB (p=0.0145; standard 95% CI of 4.8-53% increase) when compared with no culling areas. After adjustment for overdispersion, the CI expands to: 2.4% decrease to 65% increase. Donnelly et al.Nature 426, 834-837, 2003. 34
colour marked bait matching bait returns to setts Bait marking A standard technique for mapping badger home ranges 35
Triplet D no culling reactive culling The first comparison: reactive culling Bait marking data were consistent with hypothesis that badgers range more widely when densities are reduced by reactive culling data from triplets B, D, G & H no culling 36
data from triplets B, C, D, G & H badger density badger movement Furthermore… Badger densities were slightly reduced, and badger movements expanded, on land immediately outside proactive culling areas This means that, if disruption of badger spatial organization caused the increased cattle TB incidence in reactive culling areas,we should see the same effect on farms neighbouring proactive culling areas 37
0 100km Results from inside proactive culling areas Proactive Survey-only The incidence of cattle TB inside proactive culling areas was 19% lower than that inside survey-only areas (95% CI: 6.2 to 30% lower) 38
0 100km Results from just outside proactive culling areas Proactive Survey-only The incidence of cattle TB up to 2km outside proactive culling areas was 29% higher than that on farms up to 2km outside survey-only areas (95% CI: 5.0 to 58% higher) 39
FMD Data – What is available now? Full data are available to research workers. See: Defra’s Animal Health and Welfare: FMD Data Archive https://secure2.csl.gov.uk/fmd/ 40
MRC Centre for Outbreak Analysis and Modelling • Founded in March 2007 with Prof Neil Ferguson as Director. • Its mission is to be an international resource and centre of excellence for research on the epidemiological analysis and modelling of novel infectious disease outbreaks. • The centre will undertake applied collaborative work with national and international agencies in support of policy planning and response operations against emerging infectious disease threats. • Based at Imperial College London, the Centre also involves staff at the UK Health Protection Agency. 41