Download
1 / 55
550 likes | 926 Views
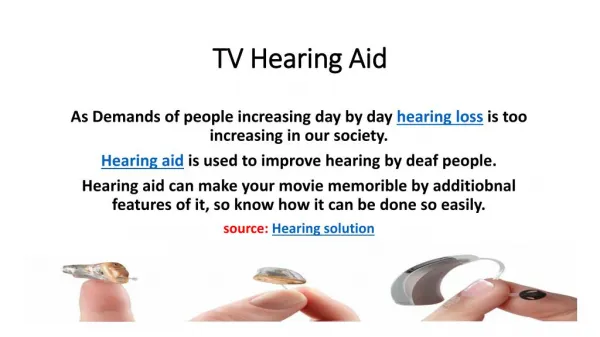
Reasons to Test Hearing Aids. Test functionality: Is the hearing aid working properly? Does it produce too much noise? It is distorting the input signal?Verify the fitting: Is the hearing aid producing suitable amplification for the patient's hearing loss?Provide a baseline: Use for future comparison testing.

E N D
1. A-35 Hearing Aid Analyzer For testing and verification of all types and sizes of hearing aids
2. Reasons to Test Hearing Aids Test functionality: Is the hearing aid working properly? Does it produce too much noise? It is distorting the input signal?
Verify the fitting: Is the hearing aid producing suitable amplification for the patient�s hearing loss?
Provide a baseline: Use for future comparison testing There are many reasons to test hearing aids, but the most commonly performed tests by clinicians fall into one of the following three categories:
Is the hearing aid functioning properly? This type of testing is done to make sure that all the components of the hearing aid are functioning properly. Hearing aid functionality testing can be performed using simple coupler measurements that do not require any particular technical expertise. For instance, a receptionist at a hearing aid office can do this testing while the patient waits for the hearing instrument specialist or audiologist.
Fitting Verification: Verification is performed during or after the hearing aid fitting process. Using real-ear measurements, the clinician can determine the hearing aid response inside the patient�s ear canal and make adjustments according to an independent target such as NAL-NL1 or DSL i/o. Alternately, hearing aid verification can be performed using coupler measurements to a target, but this is more common when fitting infants and small children, although it is someone used to pre-fit hearing aids for adults.
Baseline testing: This type of testing is a typically an automated coupler test performed after the hearing aid fitting. It is used to establish a baseline for the hearing aid so that if the patient returns to the office and is no longer satisfied with the hearing aid, a new test can be performed against the baseline to see if anything has changed. This type of testing is quick and easy to perform.There are many reasons to test hearing aids, but the most commonly performed tests by clinicians fall into one of the following three categories:
Is the hearing aid functioning properly? This type of testing is done to make sure that all the components of the hearing aid are functioning properly. Hearing aid functionality testing can be performed using simple coupler measurements that do not require any particular technical expertise. For instance, a receptionist at a hearing aid office can do this testing while the patient waits for the hearing instrument specialist or audiologist.
Fitting Verification: Verification is performed during or after the hearing aid fitting process. Using real-ear measurements, the clinician can determine the hearing aid response inside the patient�s ear canal and make adjustments according to an independent target such as NAL-NL1 or DSL i/o. Alternately, hearing aid verification can be performed using coupler measurements to a target, but this is more common when fitting infants and small children, although it is someone used to pre-fit hearing aids for adults.
Baseline testing: This type of testing is a typically an automated coupler test performed after the hearing aid fitting. It is used to establish a baseline for the hearing aid so that if the patient returns to the office and is no longer satisfied with the hearing aid, a new test can be performed against the baseline to see if anything has changed. This type of testing is quick and easy to perform.
3. Test Functionality Coupler Measurements This section of the presentation covers functionality testing with coupler measurements.This section of the presentation covers functionality testing with coupler measurements.
4. Test Functionality Coupler Automated Test Sequences (ANSI): Compare against manufacturing specifications and quickly determine whether the hearing aid needs repair.
Coupler Multicurve: Additional measurements for more information. Compression, Distortion, Noise Suppression There are two screens that are used to perform functionality testing on the A-35 hearing aid analyzer: The automated test sequence screen such as ANSI 96 or ANSI 03, and the Coupler Multicurve screen. The ANSI test screen is a straight-forward sequence that performs fixed testing that can be compared to manufacturing specifications. The Coupler Multicurve screen can be used to perform further testing that is not covered by ANSI.There are two screens that are used to perform functionality testing on the A-35 hearing aid analyzer: The automated test sequence screen such as ANSI 96 or ANSI 03, and the Coupler Multicurve screen. The ANSI test screen is a straight-forward sequence that performs fixed testing that can be compared to manufacturing specifications. The Coupler Multicurve screen can be used to perform further testing that is not covered by ANSI.
5. ANSI 03 Example Shown here is a sample of ANSI �03 results using an AGC hearing aid. You can see the maximum output (OSPL-90) curve, the frequency response curve, and along the right side all the numerical values are displayed, including:
Average and max of the OSPL-90 curve, The full-on and reference test gains, Equivalent input noise, Frequency range information,
And harmonic distortion.Shown here is a sample of ANSI �03 results using an AGC hearing aid. You can see the maximum output (OSPL-90) curve, the frequency response curve, and along the right side all the numerical values are displayed, including:
Average and max of the OSPL-90 curve, The full-on and reference test gains, Equivalent input noise, Frequency range information,
And harmonic distortion.
6. Example (continued) ANSI �03 results for an AGC aid also can include single or multiple input/output curves. This particular example tests the I/O at 2000 Hz only, but any combination of 250, 500, 1000, 2000, and 4000 Hz can be tested.
The key in the box designates the frequency used for each.ANSI �03 results for an AGC aid also can include single or multiple input/output curves. This particular example tests the I/O at 2000 Hz only, but any combination of 250, 500, 1000, 2000, and 4000 Hz can be tested.
The key in the box designates the frequency used for each.
7. Instructions on testing ANSI from the A-35 controls Use F5 from the Opening screen to enter to the ANSI screen.
Level the sound chamber using F5 and Start/Stop.
Use F1 to select the hearing aid type.
Press Start/Stop to run the test.
8. Coupler Multicurve Measure family of curves to check compression across entire frequency band
Check distortion at loud levels (80-90 dB SPL) to see how hearing aid distorts in a noisy environment such as a loud restaurant
Check the hearing aid�s noise suppression functionality
The Coupler Multicurve screen can be used to perform additional coupler measurements that are not in the ANSI automated test sequence. You can perform frequency responses with a variety of test signals and input levels. This allows a lot more flexibility that is possible in ANSI. A few examples of the tests that you can perform in this screen are listed in the slide above.
You can check compression using the Digital Speech signal instead of the pure-tones that are used in ANSI. This allows you to see how the overall response of the hearing aid changes as the input signal increases and decreases.
In ANSI, distortion is measured at 65 or 70 dB SPL. This is actually testing when soft speech distorts. However, most digital hearing aids should not produce much distortion, even at loud levels. Therefore, it is recommended to test distortion at loud levels such as 80 or 90 dB SPL. This will test if the hearing aid is distorting in environments such as loud restaurant noise.
A comparison of the hearing aid�s response to the Composite signal and the Digital Speech signal can give you lots of useful information about how the hearing aid suppresses the signal in the presence of noise. The idea is that the hearing aid will respond to the Digital Speech signal as it would to speech, and it will respond to the Composite signal as it would to noise. Therefore, compare the response to the two signals to see how much noise suppression the hearing aid actually has. This can be a great tool you can use to show your patient how well the hearing aid technology works.The Coupler Multicurve screen can be used to perform additional coupler measurements that are not in the ANSI automated test sequence. You can perform frequency responses with a variety of test signals and input levels. This allows a lot more flexibility that is possible in ANSI. A few examples of the tests that you can perform in this screen are listed in the slide above.
You can check compression using the Digital Speech signal instead of the pure-tones that are used in ANSI. This allows you to see how the overall response of the hearing aid changes as the input signal increases and decreases.
In ANSI, distortion is measured at 65 or 70 dB SPL. This is actually testing when soft speech distorts. However, most digital hearing aids should not produce much distortion, even at loud levels. Therefore, it is recommended to test distortion at loud levels such as 80 or 90 dB SPL. This will test if the hearing aid is distorting in environments such as loud restaurant noise.
A comparison of the hearing aid�s response to the Composite signal and the Digital Speech signal can give you lots of useful information about how the hearing aid suppresses the signal in the presence of noise. The idea is that the hearing aid will respond to the Digital Speech signal as it would to speech, and it will respond to the Composite signal as it would to noise. Therefore, compare the response to the two signals to see how much noise suppression the hearing aid actually has. This can be a great tool you can use to show your patient how well the hearing aid technology works.
9. Family of Curves to check compression Gain graphs can be used to show the hearing aid�s compression characteristics. If measurement curves are performed with varying intensity, and all the curves have equal gain, the hearing aid is acting linearly. If, as shown above, the curves produce less gain with louder intensity signals, the hearing is compressing the signal.
These curves were taken with the Digital Speech signal at 50, 60, 70, and 80 dB SPL. The hearing aid is not compressing the signal until after 60 dB. You can tell this by examining curve 1 (50 dB) and curve 2 (60 dB). These curves produce the same amount of gain. At 70 and 80 dB SPL, however, the gain provided by the hearing aid declines with increasing amplitude.Gain graphs can be used to show the hearing aid�s compression characteristics. If measurement curves are performed with varying intensity, and all the curves have equal gain, the hearing aid is acting linearly. If, as shown above, the curves produce less gain with louder intensity signals, the hearing is compressing the signal.
These curves were taken with the Digital Speech signal at 50, 60, 70, and 80 dB SPL. The hearing aid is not compressing the signal until after 60 dB. You can tell this by examining curve 1 (50 dB) and curve 2 (60 dB). These curves produce the same amount of gain. At 70 and 80 dB SPL, however, the gain provided by the hearing aid declines with increasing amplitude.
10. Another Family of Curves These curves were taken at 50, 65, 75, and 80 dB SPL with the Digital Speech signal. The hearing aid is acting linearly until 70 dB and then compression the signal slightly at 80 dB.These curves were taken at 50, 65, 75, and 80 dB SPL with the Digital Speech signal. The hearing aid is acting linearly until 70 dB and then compression the signal slightly at 80 dB.
11. Instructions on how to run a family of coupler curves Press F3 from the Opening Screen to enter the Coupler Multicurve screen
Use F2 to select the curve #.
Use F4 to select the source type.
Use up-down arrows to select amplitude.
Press Start/Stop to run test and Start/Stop again once measurement has stabilized.
Repeat Steps 2-5 as needed.
12. Levels of Speech Peaks
13. Harmonic Distortion Test The ANSI, IEC, and JIS automated test sequences measure harmonic distortion at 65 and 70 dB SPL. However, these levels translate to the peak levels of soft speech. Most digital hearing aids should produce very little distortion at these levels. It is more interesting to look at if the hearing aid is distorting at high intensity levels such as 80 or 90 dB SPL. The curve shown above was measured at 90 dB SPL. The bars on the graph indicate the harmonic distortion of the hearing aid at that level.The ANSI, IEC, and JIS automated test sequences measure harmonic distortion at 65 and 70 dB SPL. However, these levels translate to the peak levels of soft speech. Most digital hearing aids should produce very little distortion at these levels. It is more interesting to look at if the hearing aid is distorting at high intensity levels such as 80 or 90 dB SPL. The curve shown above was measured at 90 dB SPL. The bars on the graph indicate the harmonic distortion of the hearing aid at that level.
14. Instructions on how to test harmonic distortion Press F3 from the Opening Screen to enter the Coupler Multicurve screen.
Use F4 to set source type to NORM.
Use up arrow key to set source level to 90 dB SPL.
Press Start/Stop. This will run a pure-tone sweep with harmonic distortion.
15. Check Noise Suppression Many digital hearing aids have special technology that suppresses noise signals while amplifying speech signals. The techniques used to perform this manipulation vary, but most of them are based upon noise being a constant signal and speech being a modulated signal. The FONIX A-35 Digital Speech signal is a modulated composite signal. The Composite signal is a constant noise. You can use the Coupler Multicurve test screen to compare the response of the hearing aid to Digital Speech and it�s response to Composite. This comparison will demonstrate how well the hearing aid suppresses noise signals. This noise suppression can vary from model to model.Many digital hearing aids have special technology that suppresses noise signals while amplifying speech signals. The techniques used to perform this manipulation vary, but most of them are based upon noise being a constant signal and speech being a modulated signal. The FONIX A-35 Digital Speech signal is a modulated composite signal. The Composite signal is a constant noise. You can use the Coupler Multicurve test screen to compare the response of the hearing aid to Digital Speech and it�s response to Composite. This comparison will demonstrate how well the hearing aid suppresses noise signals. This noise suppression can vary from model to model.
16. Instructions on how to test noise suppression Press F3 from the Opening Screen to enter the Coupler Multicurve screen.
Use F4 to set the source type to DIG SPCH.
Use up-down arrows to set the amplitude to 65 dB SPL.
Press Start/Stop to run the curve. Press Start/Stop gain when it stabilizes.
Press F2 to select CRV 2.
Use F4 to set the source type to COMP.
Repeat Steps 3-4.
18. ANSI S3.22
19. ANSI Completed
20. Coupler Multicurve
21. Multicurve Completed
22. Harmonic Distortion
23. Harm Distortion Completed
24. Noise Suppression
25. Noise Suppression Completed
26. Verification Real-ear Measurements This section will focus on the A-35�s real-ear capability. Real-ear is used to verify the hearing aid fitting and make sure that it is appropriate for the patient�s hearing loss.This section will focus on the A-35�s real-ear capability. Real-ear is used to verify the hearing aid fitting and make sure that it is appropriate for the patient�s hearing loss.
27. Real-ear Configuration The A-35 real-ear can be used with the internal A-35 speaker or an optional external speaker on a swing arm (as shown in this slide) or a floor stand. The internal speaker is best if the A-35 is moved around as a portable device. If the A-35 is in one location most of the time, we recommend using an external speaker for real-ear measurements.The A-35 real-ear can be used with the internal A-35 speaker or an optional external speaker on a swing arm (as shown in this slide) or a floor stand. The internal speaker is best if the A-35 is moved around as a portable device. If the A-35 is in one location most of the time, we recommend using an external speaker for real-ear measurements.
28. Verify the hearing aid fitting Enter audiogram and generate target
Use Insertion Gain for checking compression and gain
Use Real-ear SPL screen for comparing real-ear against HTLs and UCLs.
Visible Speech
Test Directionality
After an audiogram is input and a target is generated, real-ear can be used to compare the hearing aid�s response inside the patient�s ear to a real-ear target. This target can be in terms of insertion gain or SPL. All measurements and targets are automatically converted when switching between measurement screens, so it is possible to view the results in different ways to get a complete picture of the hearing aid fitting.
Insertion Gain is the more traditional way of performing real-ear measurements. You can perform an unaided measurement and up to three different aided measurements. Insertion Gain is useful in determining exactly how much amplification the hearing aid is providing above and beyond the patient�s unaided response. It can also be used to show the compression characteristics of the hearing aid.
The Real-ear SPL screen is used to compare the patient�s real-ear response to the thresholds and uncomfortable levels. All measurements, targets, and audiometric data are converted into real-ear SPL so that they can be directly compared. This gives you a complete picture of the hearing aid fitting.
The Visible Speech feature allows you to test the hearing aid using a live speech signal. A real-ear response is shown as well as a long-term average response. These can be directly compared to the thresholds, UCLs, and real-ear target.
The Insertion Gain screen can also be used to test the hearing aid�s directionality. This is described later in the presentation.After an audiogram is input and a target is generated, real-ear can be used to compare the hearing aid�s response inside the patient�s ear to a real-ear target. This target can be in terms of insertion gain or SPL. All measurements and targets are automatically converted when switching between measurement screens, so it is possible to view the results in different ways to get a complete picture of the hearing aid fitting.
Insertion Gain is the more traditional way of performing real-ear measurements. You can perform an unaided measurement and up to three different aided measurements. Insertion Gain is useful in determining exactly how much amplification the hearing aid is providing above and beyond the patient�s unaided response. It can also be used to show the compression characteristics of the hearing aid.
The Real-ear SPL screen is used to compare the patient�s real-ear response to the thresholds and uncomfortable levels. All measurements, targets, and audiometric data are converted into real-ear SPL so that they can be directly compared. This gives you a complete picture of the hearing aid fitting.
The Visible Speech feature allows you to test the hearing aid using a live speech signal. A real-ear response is shown as well as a long-term average response. These can be directly compared to the thresholds, UCLs, and real-ear target.
The Insertion Gain screen can also be used to test the hearing aid�s directionality. This is described later in the presentation.
29. Audiogram Entry Screen The Audiogram Entry screen is used to enter the patient's audiogram and generate an appropriate target. You can also perform a measured RECD in this screen.The Audiogram Entry screen is used to enter the patient's audiogram and generate an appropriate target. You can also perform a measured RECD in this screen.
30. NAL-NL1 Non-linear Target Features Age of client (months)
Number of channels
Bone conduction
Bilateral vs. Unilateral loss
Limiting: Multi-channel or Wideband
Compression threshold
The NAL-NL1 target has many adjustments to make it suitable for your patient�s hearing loss and hearing aid type. Changing these settings makes the real-ear target more accurate.The NAL-NL1 target has many adjustments to make it suitable for your patient�s hearing loss and hearing aid type. Changing these settings makes the real-ear target more accurate.
31. Instructions to enter audiogram and generate a target Press F2 from Opening Screen to enter Real-ear mode.
Use NEXT or BACK to enter Audiogram Entry screen, if necessary.
HTL should be selected above F2. If not, use F2 until selected.
Use arrow keys to input audiogram.
Use F2 to select bone and repeat process (optional)
Press F3 to generate target.
Press MENU and BACK to change target settings.
Press EXIT to close target menu.
32. Quick Review of Real-ear Terminology REUG = Real ear unaided gain. This is the difference between the probe microphone inside the ear and the reference microphone outside the ear.
REAG = Real ear aided gain. Same concept except aided.
REIG = Real ear insertion gain.
REIG = REAG � REIG.
33. Real-ear Gain The Unaided and Aided Gain screen is used to measure the unaided response and up to three different aided response. No targets are available in this screen.The Unaided and Aided Gain screen is used to measure the unaided response and up to three different aided response. No targets are available in this screen.
34. Insertion Gain The Insertion Gain screen can display the real-ear insertion gain target and up to three different aided measurements. The unaided response can also be measured and displayed in this screen. The insertion gain target is based upon the input level of the Aided #2 curve by default. However, you can set the target to automatically adjust to the current selected curve.The Insertion Gain screen can display the real-ear insertion gain target and up to three different aided measurements. The unaided response can also be measured and displayed in this screen. The insertion gain target is based upon the input level of the Aided #2 curve by default. However, you can set the target to automatically adjust to the current selected curve.
35. Instructions on performing REIG measurements Press BACK from Audiogram Entry screen to enter Insertion Gain screen.
Press MENU and make sure Auto Mode is set to ON. Use arrow keys if necessary. Use EXIT to close menu.
Set up patient for REM (without hearing aid)
Press F5 and START to level the sound field speaker.
Press START/STOP to measure unaided response. Press it again when stabilized.
Insert hearing aid in ear.
Press START/STOP to measured aided responses. With Auto Mode, the analyzer will automatically measure Ins. Gain #1, #2, and #3.
36. Real-ear SPL Measurements In the Real-ear SPL screen, three aided measurements (and an unaided measurement) can be performed. Typically, AIDED 1 is used at to make sure that soft sounds meet the patient's threshold values. AIDED 2 is used to make sure medium speech meets the target. AIDED 3 is used to make sure that loud sounds are below the patient's uncomfortable levels.In the Real-ear SPL screen, three aided measurements (and an unaided measurement) can be performed. Typically, AIDED 1 is used at to make sure that soft sounds meet the patient's threshold values. AIDED 2 is used to make sure medium speech meets the target. AIDED 3 is used to make sure that loud sounds are below the patient's uncomfortable levels.
37. Instructions on performing Real-ear SPL measurements Press NEXT from Audiogram Entry screen to enter Real-ear SPL screen.
Press MENU and make sure Auto Mode is set to ON. Use arrow keys if necessary. Use EXIT to close menu.
Set up patient for REM (with hearing aid but turned off)
Press F5 and START/STOP to level the sound field speaker.
Turn on hearing aid.
Press START/STOP to measure aided curves. When Auto Mode is enabled, Aided #1, #2, and #3 will be measured.
38. Visible Speech The Visible Speech screen is used to perform live speech measurements. This can be a very useful counseling tool for the patient and family members. In software version 3.80, we added the ability to display the long-term average response in addition to the real-time response. The long term average response is useful for comparing against the threshold levels and target. The real-time response demonstrates how the hearing aid reacts to the changing speech signal.The Visible Speech screen is used to perform live speech measurements. This can be a very useful counseling tool for the patient and family members. In software version 3.80, we added the ability to display the long-term average response in addition to the real-time response. The long term average response is useful for comparing against the threshold levels and target. The real-time response demonstrates how the hearing aid reacts to the changing speech signal.
39. Instructions on using Visible Speech Enter Real-ear SPL screen.
Press MENU and use arrow keys to set
VISIBLE SPEECH to AVERAGE
AUTO MODE to OFF.
Press EXIT to close menu.
Use F4 to set source to COMP.
Use down arrow key to turn SOURCE OFF.
Press START/STOP to start measurement.
Read passage to patient or have patient�s spouse read passage. Average input level is shown to the right off the graph as �REF�
Press START/STOP to stop test.
40. Directional Hearing Aids Real-ear measurements can be used to test the directionality of hearing aids. Two measurements are performed: one with the patient pointed away from the speaker, and the other with the patient pointed towards the speaker. Real-ear measurements can be used to test the directionality of hearing aids. Two measurements are performed: one with the patient pointed away from the speaker, and the other with the patient pointed towards the speaker.
41. Directional Display This is an example of the �forward� and �reverse� measurements of the directional test.This is an example of the �forward� and �reverse� measurements of the directional test.
42. Directional Advantage This aid shows more directional advantage in the high frequencies than in the low frequencies. The insertion gain screen subtracts the reverse measurement from the forward measurement, showing the actual directional advantage of the hearing aid.This aid shows more directional advantage in the high frequencies than in the low frequencies. The insertion gain screen subtracts the reverse measurement from the forward measurement, showing the actual directional advantage of the hearing aid.
43. Instructions on Testing Directional Aids � Reverse Enter Real-ear Unaided & Aided screen.
Press MENU and make sure AUTO MODE is set to OFF. Press EXIT to close menu.
Position speaker behind the patient at 180 or 135 degrees.
Place probe tube and hearing aid on patient�s ear. Turn off hearing aid
Press F5 and START/STOP to Level the sound field speaker.
Turn on hearing aid.
Use F2 to select CUSTOM UNAIDED
Use F5 to select DIG SPCH. The input level should be set to 65 dB SPL.
Press START/STOP to perform test. Press START/STOP again when stabilized.
44. Instructions on Testing Directional Aids � Forward Position speaker in front of patient at 0 degrees or 45 degrees.
Place probe tube and hearing aid on patient�s ear. Turn off hearing aid.
Press F5 and START/STOP to Level the sound field speaker.
Use F2 to select AIDED #2. The source level should automatically be set to DIG SPCH and the input level should be set to 65 dB SPL.
Press START/STOP to perform test. Press START/STOP again when stabilized.
46. Audiometric Info tab
47. Send Audiogram to A-35
48. Target Settings
49. Measurements & Targets
50. Curve Box Actions Each measurement curve corresponds to one row in the curve box.
Each measurement curve has a corresponding target.
Fill in the �X� of the curves you want to display.
Choose the source type and amplitude of each curve, as needed.
The checkmark to the left of the curve rows indicates the current selected curve
51. To perform real-ear measurements Set up the patient for REM.
Click Level to level the sound field speaker.
Select the aided measurement curves you want to test.
Select �Run measurements automatically.�
Click Start. This will run through all selected measurement curves.
52. Establish a Baseline Coupler Measurements using FONIX Troubleshooter This section describes coupler measurements that can be used to produce a baseline for the hearing aid fitting. Baseline test results are used to save time troubleshooting the hearing aid when the patient comes back into the office for a checkup or hearing aid repair. We have created a great test sequence for producing baseline measurements. It is available in our FONIX Troubleshooter program, a NOAH module. This section describes coupler measurements that can be used to produce a baseline for the hearing aid fitting. Baseline test results are used to save time troubleshooting the hearing aid when the patient comes back into the office for a checkup or hearing aid repair. We have created a great test sequence for producing baseline measurements. It is available in our FONIX Troubleshooter program, a NOAH module.
53. Baseline Testing Short automated test
Performed after the hearing aid has been adjusted to the patient but before hearing aid leaves the office
Repeated whenever hearing aid returns to office
Allows clinician to quickly determine if the hearing aid response or characteristics have changed
Baseline measurements can be made after a hearing aid fitting to create a record of the hearing aid�s response as it goes out the door with the patient. The baseline test results go into the patient�s file. If the hearing aid comes back into to the office for repair, the test can be repeated and compared against the baseline to quickly determine if anything in the hearing aid�s response has changed. This can save a lot of time troubleshooting the hearing aid.
Baseline measurements can be made after a hearing aid fitting to create a record of the hearing aid�s response as it goes out the door with the patient. The baseline test results go into the patient�s file. If the hearing aid comes back into to the office for repair, the test can be repeated and compared against the baseline to quickly determine if anything in the hearing aid�s response has changed. This can save a lot of time troubleshooting the hearing aid.
54. FONIX Troubleshooter NOAH Module
Windows-based interface
One button test
Profiler: Advanced alternative to ANSI, using Digital Speech signal The FONIX Troubleshooter is a NOAH module that performs quick and easy coupler measurements. ANSI is available, but it can also perform Profiler testing. Profiler is an advanced alternative to ANSI that uses Digital Speech signals at increasing intensity levels instead of a pure-tone sweep at a single level. The FONIX Troubleshooter is a NOAH module that performs quick and easy coupler measurements. ANSI is available, but it can also perform Profiler testing. Profiler is an advanced alternative to ANSI that uses Digital Speech signals at increasing intensity levels instead of a pure-tone sweep at a single level.
55. Profiler with Troubleshooter This is an example of Profiler test results. The following measurements are performed at user test gain (except where noted):
OSPL90: a pure-tone sweep at 90 dB SPL
Digital Speech curves at 50, 65, and 80 dB SPL
Equivalent input noise
Harmonic distortion
Average gain at 65 dB SPL
Maximum output
Reserve gain at 65 dB SPL at full-on gain to determine headroomThis is an example of Profiler test results. The following measurements are performed at user test gain (except where noted):
OSPL90: a pure-tone sweep at 90 dB SPL
Digital Speech curves at 50, 65, and 80 dB SPL
Equivalent input noise
Harmonic distortion
Average gain at 65 dB SPL
Maximum output
Reserve gain at 65 dB SPL at full-on gain to determine headroom