Download
1 / 23
230 likes | 332 Views
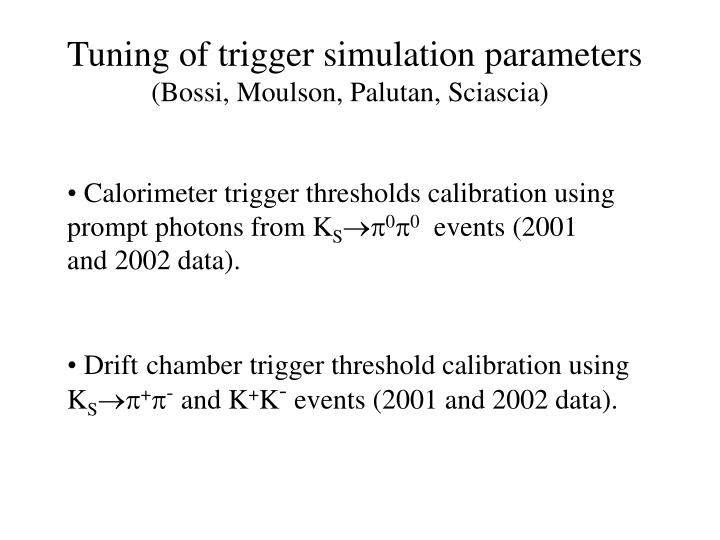
Tuning of trigger simulation parameters (Bossi, Moulson, Palutan, Sciascia) Calorimeter trigger thresholds calibration using prompt photons from K S p 0 p 0 events (2001 and 2002 data). Drift chamber trigger threshold calibration using

E N D
Tuning of trigger simulation parameters • (Bossi, Moulson, Palutan, Sciascia) • Calorimeter trigger thresholds calibration using • prompt photons from KSp0p0 events (2001 • and 2002 data). • Driftchamber trigger threshold calibration using • KSp+p- and K+K- events (2001 and 2002 data).
Calorimeter trigger • An effective threshold is evaluated comparing the energy of a photon cluster (from KSp0p0 events) with the trigger sector response. An unbiasing condition is imposed to the remaining clusters of the event (two sectors fired). • During 2001 and 2002 data taking periods, a dishmap with unbalanced endcap thresholds has been used. A single step has been applied to the hardware thresholds of some endcap sectors at the beginning of 2002 data taking, to recover 2001 running condition. • Data samples used for calibration (neutral kaons DST’s): • 2001 run 20800-21800 = 37 pb-1 • 2002-ini run 23600-23980 = 26 pb-1 • new hardware map starting from run 24036 • 2002-mid run 24700-25000 = 17 pb-1 • 2002-end run 26090-26500 = 45 pb-1
Barrel thresholds in the standard trigger simulation 2002-ini MC Th (MeV) data Z (cm)
2002-mid + 2002-end MC data
Data/MC comparison : Endcap unbalanced Short modules (HOT) Beside the Beam pipe (WARM) Th (MeV) Th (MeV) BEAM BEAM Y (cm) Y (cm) out of acceptance 2002-ini
Data/MC comparison : Endcap COLD Th (MeV) 2002-ini Y (cm)
Data/MC comparison for charged pions (KSp+p-) The effective threshold is computed on clusters associated to charged pion tracks (well separated pion clusters + unbiasing procedure) Th (MeV) NB: the threshold have been calibrated on photons 2002-ini Z (cm)
Data/MC relative spread: photons on barrel Th (MeV) 2002-end 2002-ini 10% band Z (cm)
Data/MC relative spread: photons on HOT sectors 2002-end 10% band 2002-ini
Data/MC relative spread: photons on WARM sectors 2002-end 10% band 2002-ini
Data/MC relative spread: pions on barrel 2002-end 2002-ini 10% band
MC efficiency spread for a +/- 5% overall threshold drift p0p0p0 KSp0p0 p+p-p0 d 0.5% Ke3 Km3 KL decay
MC efficiency spread for a +/- 5% overall threshold drift KSp+p- p0p0p0 p+p-p0 d 1% Ke3 Km3 KL decay
Photon probability to fire the fifth plane A better tuning is needed if the T3 filter has to be simulated...
DC trigger: T2D effective threshold • No hardware monitor on the • superlayer response (MC tuning can be performed only on the global trigger decision ) • T2D decision is processed after 1.3ms of integration (also in the simulation) • The ADC counts from the hardware monitor of the CAFFE board are not easily translated into a number of hits • the T2D responseis correlated with the total number of reconstructed hits • it is important to take into account the charged BKG • (gg events + insert module) e (T2D) KSp+p- MC K+K- MC + bkg DC hits
MC + different bkg samples e (T2D) fixed MC th For each period ~1 pb-1 of gg events has been filtered to get the charged BKG sample. DC hits
data/MC comparison: 2002-end sample e (T2D) A single T2D threshold value (72 hits within 1.3 ms) fits approximately both the neutral and charged kaon efficiency profiles DC hits
data/MC comparison: 2002-ini sample e (T2D) The same T2D threshold is applied to the different samples (as in the real hardware maps) DC hits
data/MC comparison: 2001 sample e (T2D) DC hits
hardware/bkg/calibration stability Th(data) Th(data) - Th(MC) 2001 2002 2001 2002 RMS kpm = 2.5 RMS k0 = 1.9
± 2 ± 2 ± 1 Effective Threshold vs T2D Threshold (MC)
MC efficiency spread for ± 1 hit threshold shift Th D K+K- 75.0% 2.4% KSKL 60.6% 1.3% KSp+p- KLpen87.9% 0.7% KLpmn 87.7% 0.7% KLp+ p- p087.0% 0.7% p-p+p062.5% 3.2%