Download
1 / 54
540 likes | 651 Views
2009 Danville Region Social Capital Survey. Center for Survey Research A Unit of the Weldon Cooper Center for Public Service University of Virginia. October 20, 2009. Report Authors. Deborah L. Rexrode Staff Research Analyst Thomas M. Guterbock Director Center for Survey Research.

E N D
2009 Danville RegionSocial Capital Survey Center for Survey Research A Unit of the Weldon Cooper Center for Public Service University of Virginia October 20, 2009
Report Authors Deborah L. Rexrode Staff Research Analyst Thomas M. Guterbock Director Center for Survey Research
Purpose of Survey • To measure how people feel about the region and their future in it • To measure people’s attachment to their community • To measure the region’s social capital • To gather baseline data to be compared to results of future, bi-annual surveys
Survey Features • SPONSOR: Danville Regional Foundation • n = 1,026 • Samples • 3 geographic areas: City of Danville, Pittsylvania County, and Caswell County, NC • Respondent selection within household • CATI (Computer-Assisted Telephone Interviewing) • Solid interviewer training and pretest { RDD (random digit dialing) Listed Cell-Phone
Survey Accuracy • Margin of error: +/- 3.7% • Data weighted on gender, geographic region, home ownership, and race.
Age of Respondents by Phone Type Reaching respondents by cell phone provides better coverage of young people, unmarried, renters, minorities, newcomers.
Survey Topics • Overall quality of life in the Danville Region • Community Attachment • Civic Participation • Political Participation • People in the Economy • Children and Schools • Health Issues
National, Regional, State andLocal Comparisons • An attempt was made in the design of this study to use comparable measures with other county, regional, state, and national studies. • There is no single source of information to use in comparing these survey results with broader results. • The report reflects some individual item comparisons where possible.
Survey Highlights • Danville area residents rate their region fairly high for quality of life • Danville area residents have a strong sense of community, social connectedness and religious involvement • However, civic involvement lags somewhat behind averages elsewhere • Many Danville area residents worry about their children’s future
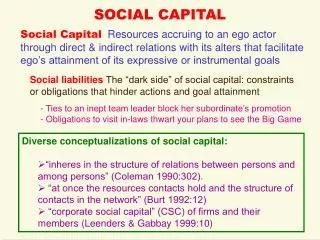
What is “Social Capital” “By ‘social capital,’ I mean features of social life – networks, norms, and trust – that enable participants to act together more effectively to pursue shared objectives.” --Robert Putnam “Social capital refers to our relations with one another…I use the term ‘civic engagement’ to refer to people’s connections with the life of their communities, not merely with politics.” --James S. Coleman
Quality of Life . . . and wanting to live in the Danville Region
Quality of Life • Rated on a ten-point scale (10 = highest) • Danville Region rating: 7.30 • Albemarle County (2008): 8.01 • Spotsylvania County (2007): 7.39 • Bedford County (2001) 7.80 • Prince William County (2009) 7.30
Overall Quality of Life Ratings Best (8-10) Middle (6-7) Worst (1-5)
Quality of Life • Overall rating of quality of life in the Danville Region of 7.30 is relatively high • Residents of Pittsylvania County, VA and Caswell County, North Carolina rate the quality of life higher than those who live in Danville city. • Long-time residents are concerned about the quality of life in the Danville Region in the future
Community Attachment Index • Relatives who live within driving distance • Relatives who live within walking distance • How important it is to feel a part of the community • How often you feel a sense of belonging or membership in the community • How much you feel at home in the area where you live • How much you feel you have a lot in common with the people in your community • How much you care what others think of your actions • How important it is to live in this particular area
Community Attachment • Overall average score was 4.15. • Compared to the AARP national study: 4.20. • People who answered “yes” or “strongly agree” for six or more of the variables in the index gave higher ratings for the overall quality of life in the Danville Region.
Community Attachment • Residents of the Danville Region have a strong sense of community, feel a sense of belonging, and feel it is important to live in this area • Residents of the Danville Region feel they have an impact in making their community a better place to live • Some residents expressed concern for safety in shopping areas • The level of community attachment is at parity with national averages.
Strongest Membership in Community Organizations • Religious organizations (69%) • Hobby and recreation groups (24%) • School support groups (24%) • Organizations for older adults (24%) Higher than the AARP national study.
Lower Memberships in Community Organizations • Labor unions (6.6%) • Professional and trade organizations (23%) • Neighborhood associations (12.6%) Lower than the AARP national study.
Volunteer Hours Lower volunteering hours than national average Higher involvement in churches and religious organizations. Lower involvement in foundations, fraternal associations, business organizations, community action organizations, and housing associations.
Civic Skills Officer percentages: Social Benchmark – 19.5% AARP – 26% NWAF – 33%
Civic Involvement • Actively involved in religious organizations • Support school activities • Only a small percentage participate to the level of acquiring civic skills • Volunteering: less than national averages • Results indicate the need for programs in the area that directly foster leadership and civic involvement
Trust in Government “Only some of the time” Social Benchmark – 46.5% AARP – 41%
Special Training—for what? 64% of employed respondents said they would be likely to take special training. This graph shows the reasons why.
Economic Situation • More than 50% of respondents have been affected by the economic downturn • A significant number of residents are currently unemployed, temporarily laid off or disabled, and only working part-time. • Most employed residents derive meaning from their work and feel a sense of accomplishment • A significant number are working more than 40 hours a week and holding more than one job
Stay or Go?What is Best for Children Q: “When a child from the Danville region is ready to leave home, do you think it would be better for them to stay in the Danville region or move to some other area to live?”
Schools and Children • More than three-fourths of respondents said that the Danville Region is a good place to raise children • Nearly 70% said when a child is ready to leave home, it is better for them to move away • Most respondents send their children to public schools. • The biggest challenge affecting children and youth is the lack of jobs


![Social Capital [II]](https://cdn3.slideserve.com/6992242/social-capital-ii-dt.jpg)
![Social Capital [III]](https://cdn3.slideserve.com/7001159/social-capital-iii-dt.jpg)