Download
1 / 22
220 likes | 337 Views
Unit 9 (FINALLY!): Data Analysis. Today: Pre-Reqs/Review Tues & Wed: LG 9-1: CLT Thurs & Fri: LG 9-2: CI Mon: Review/Practice Tues: Unit 9 Assessment (project or test?). Review of Terms. Histograms Stem and Leaf Plots Box and Whisker Plots Mean Standard Deviation

E N D
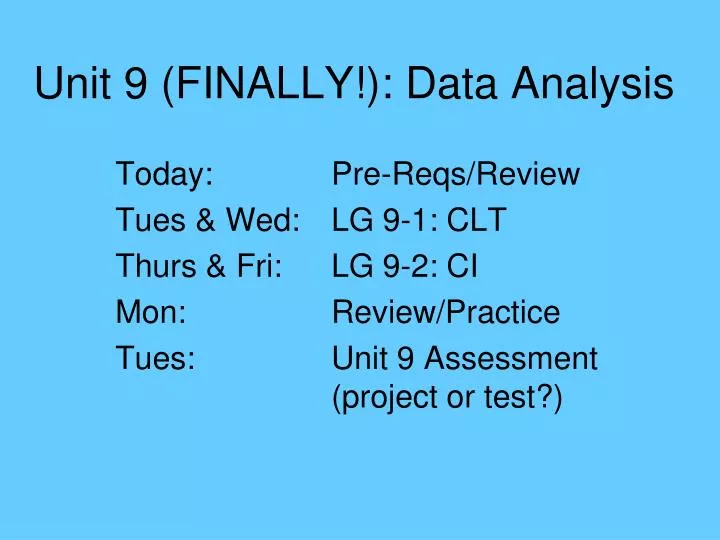
Unit 9 (FINALLY!): Data Analysis Today: Pre-Reqs/Review Tues & Wed: LG 9-1: CLT Thurs & Fri: LG 9-2: CI Mon: Review/Practice Tues: Unit 9 Assessment (project or test?)
Review of Terms • Histograms • Stem and Leaf Plots • Box and Whisker Plots • Mean • Standard Deviation • Normal Distribution/Curve • Empirical Rule • Z-scores • Probability/Percentages
Histograms Histogram • The columns are positioned over a label that represents a quantitative variable. • The column label can be a single value or a range of values. • The height of the column indicates the size of the group defined by the column label. • show how observations are distributed across groups, they do not show the exact values of individual observations. • A stem and leaf plot does show exact values of individual observations. Dot plot
Number of hurricanes that occurred each year from 1944 through 2000 as reported by Science magazine • In most of the years between 1944 and 2000 there were 3 or less hurricanes each year. • There were only 9 years in this period when 4 or more hurricanes happened in a year. • The most frequent number of hurricanes a year was 2 in this time period. • There are no outliers in this information Construct a frequency table (we will use this is a moment)
Stem and Leaf Plots The stemplot shows the number of hot dogs eaten by contestants in a recent hot dog eating contest. Find the range and median of this information I. The range is 70. II. The median is 46.
Box & Whisker Plots These numbers are called the 5 number summary. The median measures the center of the data. Q3 – Q1 = Interquartile range (IQR) measures the spread.
Consider the boxplot below. Which of the following statements are true? I. The distribution is skewed right. II. The interquartile range is about 8. III. The median is about 10.
Measures of Dispersion Visually When traveling to these two cities, would the same clothing be suitable for both cities at any time during the year from the point of view of warmth?
How to graph data in TI-83 • Clear your lists by: STAT -> EDIT -> highlight L1, L2, etc -> CLEAR -> ENTER • Enter a list of data in L1 using the frequency table • Turn on the graph: 2ND Y= -> ENTER for stat plot 1 -> ENTER to turn it on -> highlight the histogram ENTER • Set your window: WINDOW -> x: [0,8] and y: [0, 20] • Press GRAPH to view the Bar Graph for the data items. • Press Trace. An asterisk will appear on the first bar. This means that the event "1" occurred 29 times. • Use the right arrow to get the frequencies of the other events. • 2ND Y = -> ENTER for stat plot 1 -> ENTER to turn it on -> highlight the 2nd box and whisker ENTER
Box & Whisker Plot Min: 80 Q1: 105 Med: 110 Q3: 130 Max: 150 The IQ scores of 60 randomly selected 5th graders Construct a box & whisker plot for this data using your calculator
Center and Spread of Data The mean or average is a measure of the center of a distribution Standard Deviation - the square root of the variance. This quantity has the same units as the data. This is one of the most common measures of the spread of a distribution.
Find the mean and standard deviation of 5th grade IQ levels.
Normal distribution is a graph that shows how far away and how much data are from the mean. 9 8 7 6 5 4 3 2 1 Number of Students 12 13 14 15 16 17 18 19 20 21 22 Points on a Quiz Whenever you see a normal curve, you should imagine the bar graph within it.
are the same in a normal distribution. 12 13 13 14 14 14 14 15 15 15 15 15 15 16 16 16 16 16 16 16 16 17 17 17 17 17 17 17 17 17 18 18 18 18 18 18 18 18 19 19 19 19 19 19 20 20 20 20 21 21 22 12+13+13+14+14+14+14+15+15+15+15+15+15+16+16+16+16+16+16+16+16+ 17+17+17+17+17+17+17+17+17+18+18+18+18+18+18+18+18+19+19+19+19+ 19+ 19+20+20+20+20+ 21+21+22 = 867 867 / 51 = 17 9 8 7 6 5 4 3 2 1 Number of Students 12 13 14 15 16 17 18 19 20 21 22 Points on a Quiz 12, 13, 13, 14, 14, 14, 14, 15, 15, 15, 15, 15, 15, 16, 16, 16, 16, 16, 16, 16, 16, 17, 17, 17, 17, 17, 17, 17, 17, 17, 18, 18, 18, 18, 18, 18, 18, 18, 19, 19, 19, 19, 19, 19, 20, 20, 20, 20, 21, 21, 22 The mean, mode, and median
Measures of Center: Mode • A unimodal distributionis data set with one mode. • A bimodaldistributionis one with two modes, usually at some distance apart from each other. • A uniformdistributionis one in which all values occur with the same frequency (no mode/all modes). • A normal distributionis a unimodal one that is bell shaped with a peak in the middle.
Normal distributions have the same general shape, a bell shape. They are symmetric, where most of the scores are at the center rather than at the ends. These are all examples of normal distributions. Notice that they differ in how spread out they are. However, the area under each curve is the same.
Normal Distribution 100% In a normal distribution, the total area under the curve is 1 whole unit or 100%. 100% of the data is on the curve.
The normal distribution and standard deviations 34% 34% 13.5% 13.5% 2.35% 2.35% Empirical Rule: 68 – 95 – 99.7 68% of scores will fall within 1 standard deviation of the mean 95% of scores will fall within 2 standard deviations of the mean 99.7% of scores will fall within 3 standard deviations of the mean
The number of points that one standard deviation equals varies from distribution to distribution. On a math test, a standard deviation may be 7 points. If the mean was 45 (yikes!), then we would know that 68% of the students scored from 38 to 52. 2.35% 13.5% 34% 34% 13.5% 2.35% • 31 38 45 52 59 63 • Points on Math Test We also know that 95% of the students scored from 31 to 59. Finally, we know that 99.7% of the students scored from 24 to 63.
On another test, a standard deviation may equal 5 points. If the mean were 45, then 68% of the students would score from ______ to _______ points. 30 35 40 45 50 55 60 Points on a Different Test 2.35% 13.5% 34% 34% 13.5% 2.35% 40 50 We also know that 95% of the students scored from ________ to ________. Finally, we know that 99.7% of the students scored from ________ to ________. What is the probability that a student scored above 50% on the test? If 35 students took the test, how many of them scored above 50%? 35 55 30 60
Determine Probability If asked to determine the probability of an event happening, you assume a normal distribution and compute a z-score.
Find the probability of scoring 90 or below from a normally distributed data set of test scores with a mean of 100 and standard deviation of 10? Here is a distribution with a mean of 100 and standard deviation of 10: 80 90 100 110 120 -2 sd -1 sd 1 sd 2 sd What is the probability of scoring 120 or higher? What percent of your data points are < 80? What percent of your data points are > 90?