Download

1 / 17
240 likes | 527 Views
RIP Diagnosis and Visualization Software for WRF Model Output. Mark Stoelinga University of Washington Collaborators: Jim Dudhia, James Bresch, Wei Wang, Kevin Manning, and David Gill NCAR/MMM. When will RIP be available for analyzing WRF model output?.

E N D
RIP Diagnosis and Visualization Software for WRF Model Output Mark Stoelinga University of Washington Collaborators: Jim Dudhia, James Bresch, Wei Wang, Kevin Manning, and David Gill NCAR/MMM
What is RIP? • Stands for “Read/Interpolate/Plot” • Software package for displaying and analyzing raw output and derived variables from mesoscale models • Developed from 1991-2001 at NCAR and U Wash • Currently configured to process all versions of MM4/MM5 model output
Why is RIP a good candidate as a visualization tool for WRF model output? • Highly portable • Currently used by many individuals and groups, for both research and operational applications of MM5 • Up-to-date documentation exists • Fairly well-organized and commented code that many users are comfortable to “muck around” with
Why is RIP a good candidate as a visualization tool for WRF model output? • Highly portable • Currently used by many individuals and groups, for both research and operational applications of MM5 • Up-to-date documentation exists • Fairly well-organized and commented code that many users are comfortable to “muck around” with • IT’S FREE!
Other characteristics of RIP (which some might call drawbacks) • Written in Fortran-77 • Uses NCAR Graphics SPP (Version 3 or 4) • Execution is in a batch-type mode, rather than a GUI-type interface with interactive graphics
Analysis and Plotting Capabilities: • Plan view, vertical cross section, vertical profile, and sounding plots • Contour, vector/barb, color fill, and streamline plots • Trajectory calculation and plotting • Over 100 different derived fields can be calculated and displayed • All model or derived fields can be output into a Vis5D data set
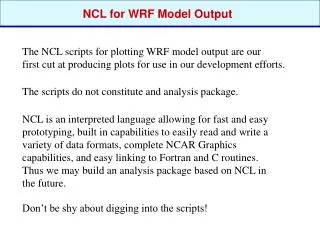
&userin idotitle=1,titlecolor='def.foreground', ptimes=0,6,12, ptimeunits='h',tacc=120,timezone=-7,iusdaylightrule=1, iinittime=1,ivalidtime=1,inearesth=0, flmin=.09, frmax=.92, fbmin=.10, ftmax=.85, ntextq=0,ntextcd=0,fcoffset=0.0,idotser=0, idescriptive=1,icgmsplit=0,maxfld=10,itrajcalc=0,imakev5d=0 &end &trajcalc rtim=15,ctim=6,dtfile=3600.,dttraj=600.,vctraj='s', xjtraj=95,90,85,80,75,70,65,80.6,80.6,80.6,80.6,80.6,80.6, yitraj=50,55,60,65,70,75,80,77,77,77,77,77,77, zktraj=.9,.9,.9,.9,.9,.9,.9,.99,.9,.8,.7,.6,.5, ihydrometeor=0 &end =========================================================================== ---------------------- Plot Specification Table --------------------- =========================================================================== feld=xlus; ptyp=hh; chfl; cosq=1,dark.gray,2,light.yellow,3,light.green,> 4,yellow,5,yellow,6,light.green,7,light.yellow,8,light.green,9,light.green,> 10,light.yellow,11,green,12,dark.green,13,green,14,dark.green,15,green,> 16,light.blue,17,green,18,green,19,light.gray,20,light.gray,21,dark.green,> 22,light.gray,23,light.gray,24,white feld=map; ptyp=hb feld=tic; ptyp=hb time=0 =========================================================================== feld=ter; ptyp=hc; cint=100; colr=red feld=map; ptyp=hb feld=tic; ptyp=hb time=0 =========================================================================== feld=ter; ptyp=hc; cint=50; cmth=fill; cosq=-1e-5,light.blue,1e-5,white,> 3000,brown feld=map; ptyp=hb feld=tic; ptyp=hb time=0 =========================================================================== Current Procedure for Using RIP on MM5 Model Output: • Model output is first converted to “RIP” format (IEEE-32-bit, each variable at each time is in separate file) • RIP input file is prepared, which specifies desired plots • RIP is executed, creating a metacode file • Graphics are viewed with standard NCAR metacode translators (or converted to GIFs, etc.)
Two Issues for Porting RIP to WRF: • RIP assumes B-grid staggering (MM5), whereas WRF uses C-grid staggering u,v v u,v u u T, p u,v v u,v
RIP assumes either the MM5 hydrostatic or nonhydrostatic sigma vertical coordinate, whereas WRF’s vertical coordinate is different from both: Hydrostatic sigma: Nonhydrostatic sigma: WRF sigma: Two Issues for Porting RIP to WRF:
“Quick Fix” short-term solution: • Interpolate WRF winds to B-grid velocity (“dot”) points • Pretend that WRF’s vertical coordinate is like MM5 nonhydrostatic sigma • Remove from the RIP code the few dependencies on the MM5 nonhydrostatic reference state
Long-term solution: • Generalize RIP to be ready to accept any grid staggering (A-, B-, or C-grid) • Generalize RIP to make no assumption about vertical coordinate. Full pressure and geopotential height must be provided at every grid point. • Take advantage of direct access capability of WRF netcdf output format, by eliminating RIPDP data translation step