Download
1 / 1
10 likes | 139 Views
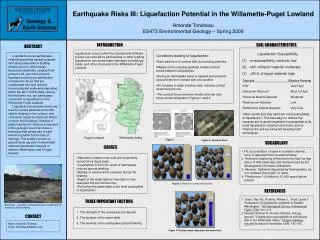
Regional Case Study II: Seismic Hazards in the Tacoma Area. Danielle (D.J.) Jaeger ES475 Environmental Geology – Spring 2009. ABSTRACT. LIDAR. INTRODUCTION. DISCUSSION.

E N D
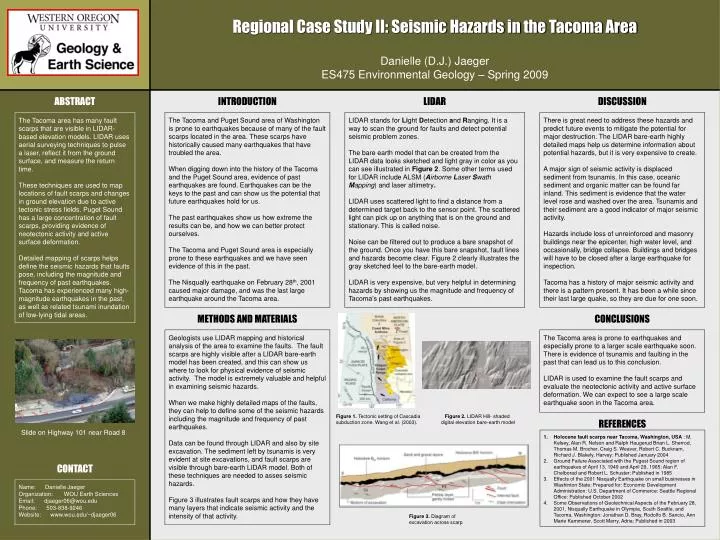
Regional Case Study II: Seismic Hazards in the Tacoma Area Danielle (D.J.) Jaeger ES475 Environmental Geology – Spring 2009 ABSTRACT LIDAR INTRODUCTION DISCUSSION The Tacoma and Puget Sound area of Washington is prone to earthquakes because of many of the fault scarps located in the area. These scarps have historically caused many earthquakes that have troubled the area. When digging down into the history of the Tacoma and the Puget Sound area, evidence of past earthquakes are found. Earthquakes can be the keys to the past and can show us the potential that future earthquakes hold for us. The past earthquakes show us how extreme the results can be, and how we can better protect ourselves. The Tacoma and Puget Sound area is especially prone to these earthquakes and we have seen evidence of this in the past. The Nisqually earthquake on February 28th, 2001 caused major damage, and was the last large earthquake around the Tacoma area. LIDAR stands for Light Detection and Ranging. It is a way to scan the ground for faults and detect potential seismic problem zones. The bare earth model that can be created from the LIDAR data looks sketched and light gray in color as you can see illustrated in Figure 2. Some other terms used for LIDAR include ALSM (Airborne Laser Swath Mapping) and laseraltimetry. LIDAR uses scattered light to find a distance from a determined target back to the sensor point. The scattered light can pick up on anything that is on the ground and stationary. This is called noise. Noise can be filtered out to produce a bare snapshot of the ground. Once you have this bare snapshot, fault lines and hazards become clear. Figure 2 clearly illustrates the gray sketched feel to the bare-earth model. LIDAR is very expensive, but very helpful in determining hazards by showing us the magnitude and frequency of Tacoma’s past earthquakes. There is great need to address these hazards and predict future events to mitigate the potential for major destruction. The LIDAR bare-earth highly detailed maps help us determine information about potential hazards, but it is very expensive to create. A major sign of seismic activity is displaced sediment from tsunamis. In this case, oceanic sediment and organic matter can be found far inland. This sediment is evidence that the water level rose and washed over the area. Tsunamis and their sediment are a good indicator of major seismic activity. Hazards include loss of unreinforced and masonry buildings near the epicenter, high water level, and occasionally, bridge collapse. Buildings and bridges will have to be closed after a large earthquake for inspection. Tacoma has a history of major seismic activity and there is a pattern present. It has been a while since their last large quake, so they are due for one soon. The Tacoma area has many fault scarps that are visible in LIDAR-based elevation models. LIDAR uses aerial surveying techniques to pulse a laser, reflect it from the ground surface, and measure the return time. These techniques are used to map locations of fault scarps and changes in ground elevation due to active tectonic stress fields. Puget Sound has a large concentration of fault scarps, providing evidence of neotectonic activity and active surface deformation. Detailed mapping of scarps helps define the seismic hazards that faults pose, including the magnitude and frequency of past earthquakes. Tacoma has experienced many high-magnitude earthquakes in the past, as well as related tsunami inundation of low-lying tidal areas. METHODS AND MATERIALS CONCLUSIONS Geologists use LIDAR mapping and historical analysis of the area to examine the faults. The fault scarps are highly visible after a LIDAR bare-earth model has been created, and this can show us where to look for physical evidence of seismic activity. The model is extremely valuable and helpful in examining seismic hazards. When we make highly detailed maps of the faults, they can help to define some of the seismic hazards including the magnitude and frequency of past earthquakes. Data can be found through LIDAR and also by site excavation. The sediment left by tsunamis is very evident at site excavations, and fault scarps are visible through bare-earth LIDAR model. Both of these techniques are needed to asses seismic hazards. Figure 3 illustrates fault scarps and how they have many layers that indicate seismic activity and the intensity of that activity. The Tacoma area is prone to earthquakes and especially prone to a larger scale earthquake soon. There is evidence of tsunamis and faulting in the past that can lead us to this conclusion. LIDAR is used to examine the fault scarps and evaluate the neotectonic activity and active surface deformation. We can expect to see a large scale earthquake soon in the Tacoma area. Figure 1. Tectonic setting of Cascadia subduction zone. Wang et al. (2003). Figure 2. LIDAR Hill- shaded digital elevation bare-earth model REFERENCES Slide on Highway 101 near Road 8 • Holocene fault scarps near Tacoma, Washington, USA : M. Kelsey, Alan R. Nelson and Ralph Haugerud Brian L. Sherrod, Thomas M. Brocher, Craig S. Weaver, Robert C. Bucknam, Richard J. Blakely, Harvey: Published January 2004 • Ground Failure Associated with the Pugest Sound region of earthquakes of April 13, 1949 and April 29, 1965: Alan F. Chelborad and Robert L. Schuster: Published in 1985 • Effects of the 2001 Nisqually Earthquake on small businesses in Washinton State: Prepared for: Economic Development Administration: U.S. Department of Commerce: Seattle Regional Office: Published October 2002 • Some Observations of Geotechnical Aspects of the February 28, 2001, Nisqually Earthquake in Olympia, South Seattle, and Tacoma, Washington: Jonathan D. Bray, Rodolfo B. Sancio, Ann Marie Kammerer, Scott Merry, Adria: Published in 2003 CONTACT Name: Danielle Jaeger Organization: WOU Earth Sciences Email: djaeger06@wou.edu Phone: 503-838-9246 Website: www.wou.edu/~djaeger06 Figure 3. Diagram of excavation across scarp