Download
1 / 34
340 likes | 462 Views
Gender and Health. Vicki S. Helgeson Carnegie Mellon University. 2008 PMBC Summer Institute. Number of Deaths per 100,000 in 2005. Source: Adapted from U.S. Census Bureau (2007). Life Expectancies Over the Twentieth Century. Source: National Center for Health Statistics (2008)

E N D
Gender and Health Vicki S. Helgeson Carnegie Mellon University 2008 PMBC Summer Institute
Number of Deaths per 100,000 in 2005 Source: Adapted from U.S. Census Bureau (2007)
Life Expectancies Over the Twentieth Century Source: National Center for Health Statistics (2008) Note: The figures from 1900 to 1960 for black people reflect “black and other” people
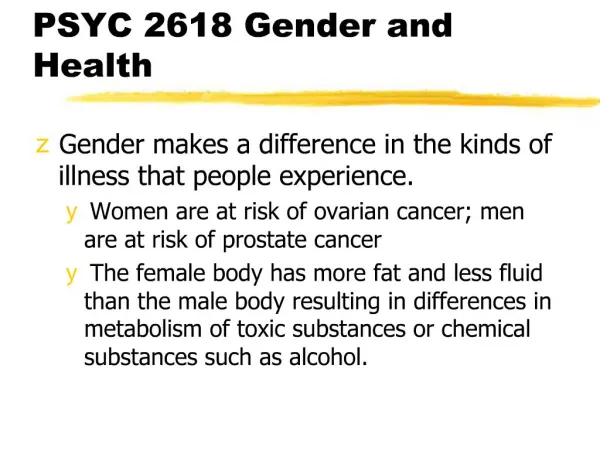
Sex Differences in Mortality ↑ Over the 20th Century What are the leading causes of death?
Age-Adjusted Death Rates (per 100,000) for the Leading Causes of Death in 2005 Source: National Vital Statistics (2008)
Paradox: Women live longer than men but… …women report worse health than men. Men have higher rates of mortality. Women have higher rates of morbidity.
Morbidity • Females greater… • Arthritis • Immune disorders • Digestive disorders • Pain-related disorders • Migraine • Carpal tunnel • Multiple Sclerosis • Females worse subjective health perceptions • Females greater symptoms (physical and psychological) • starts in adolescence
Odds ratio of Women Having More Health Symptoms than Men Across 29 European and North American Countries low GDI medium GDI high GDI 11-year-olds 1.56 1.17 1.18 13-year-olds 1.88 1.70 1.56 15-year-olds 2.27 1.91 1.88 Note: higher number = female > male GDI = Gender Development Index, high GDI signifies women have higher education ad income. Torsheim (2006)
Incidence of Major Depression Across Cultures Lifetime rate of depression Source: Adapted from Weissman et al. (1996)
Classes of Explanations • Biology • Genes • Immune system • Hormones • Health behaviors • Stressful life events • Social roles
Artifacts: Physician Bias • Depression • Women are 2x likely to be depressed as men • Clinicians more likely to classify symptoms as depression in women than men • Clinicians less likely to detect depression in men than women • PCP’s detection of depression compared to independent screening of 19,000 patients (Borowsky et al., 2000) • Clinicians more likely to provide medication to women than men, when symptoms are similar • Due to patient? • Due to provider?
Also, response bias in the area ofdepression: Depression 14 12 10 8 6 4 2 0 Depression Hassles Depression Hassles Male Female Source: Adapted from Page & Bennesch (1993)
Artifacts: Physician Bias • Coronary Heart Disease FACT: men have higher rates of heart disease than women FACT: heart disease is #1 killer of women, too FACT: onset of heart disease occurs later in women than men FACT: once diagnosed, women’s disease is more advanced than men even when controlling for age FACT: women have more complications from treatment and higher mortality rates than men
Are women treated differently than men? • Same symptoms more likely to be attributed to CHD in men than women • Partly because men and women have different symptoms men have “classic” chest pain • Men more likely than women to be referred for: • Catheterization • Cholesterol-lowering medication • Invasive treatment (PTCA, CABG) These relations generally hold when controlling for age • Men fare better following invasive treatment than women
Classes of Explanations…. Health Behaviors • Smoking: men more (but…) • Alcohol: men more (but…) • Diet: possibly women better • Exercise: men more • Preventive health care: women more
Current Smoking Percentage Source: Adapted from Centers for Disease Control and Prevention (2006)
Overweight Children and Adolescents Overweight Prevalence Source: Adapted from Ogden et al. (2002) & Ogden et al. (2006)
Life Events • Meta-analysis of trauma (Tolin & Foa, 2006) • Males > Females BUT • Females: 6x adult sexual assault, 2.5x child sexual assault • Males: 3.5x combat, war, terrorism, 1.5x nonsexual assault • Meta-analysis of stressful life events (Davis, Matthews & Twamley, 1999) • Females > Males: d = .12 • Moderator: type of rating • Stress exposure: d = +.08 • Stress impact: d = +.18 • Moderator: type of event • Interpersonal: d = +.17 • Personal: d = +.07
Sex Comparisons of Interpersonal Stress and Non-interpersonal Stress Among Preadolescents and Adolescents Interpersonal stress Non-interpersonal stress Source: Adapted from Rudolph & Hammen (1999)
Social Role: Men • Hazardous jobs (93% fatalities) • Drive more (3x fatalities) • Sex difference decreasing with time • Risk-taking behavior • Own guns • Leisure activities (hunting, skydiving, skiing, mountain climbing) • Participation in risky sports (football, wrestling) [and playing while injured]
Encouragement of Risk-Taking Behavior in Boys • Parent watched video of boy/girl on playground (ages 6-10) • Stop tape and report what they would say • Verbalization during risk-taking Source: Morrongiello & Dawber (2000)
Social Role: Women • Social network double-edged sword: • Provides support and potential to reduce stress • Provides people to take care of • Nurturant Role Hypothesis (Gove & Hughes, 1979) • Exposed to more infectious agents • Caretaking leads to fatigue and vulnerability to illness • Time spent caring for others leads to less time spent caring for self
Gender-Related Traits: Female Focus on Others Overinvolved in Other’s Problems COMMUNION UNMITIGATED COMMUNION Self-Neglect ♀
Links to Well-Being • Communion • Provides social support • Linked to social skills • Unrelated to psychological distress • Unmitigated communion • Linked to psychological distress • Linked to self-neglect • Linked to rumination about others • Linked to poor adjustment to disease • Linked to poor metabolic control ♀
UC Laboratory Studies • Exposed to person who self-discloses problem • Study 1: Friend • Study 2: Stranger Fritz & Helgeson (1998)
Adolescents with Diabetes (Helgeson & Fritz, 1996) Psychological Distress Unmitigated Communion Relationship Stressors Metabolic Control
Poor Metabolic Control __ Early Adolescence __ Middle Adolescence -1 SD +1 SD Unmitigated Communion
Adolescents with Diabetes (Helgeson et al., 2007) • 132 adolescents with diabetes • 131 healthy adolescents • Average age 12 (11-13) • Interviewed annually • UC → ↑ distress ↓ self-esteem ↓ metabolic control • UC → ↑ eating disturbances • UC → eating disturbances → distress self-esteem metabolic control
Gender-Related Traits: Male Distrust of Others Focus on Self UNMITIGATED AGENCY AGENCY Self-Absorption ♂
Links to Well-Being • Agency • Linked to good health behavior (exercise) • Linked to self-efficacy, perceptions of control • Linked to high self-esteem • Linked to reduced stress • Unmitigated agency • Linked to psychological reactance • Linked to poor health behavior • Linked to noncompliance • Linked to problem behaviors (delinquency, smoking, etc.) • Linked to hostility ♂
Change in Self-Efficacy Change in Mental Health Change in Prostate-specific Function -.29** .51*** .68*** UA .67 .66 -.30* Bowel Urine Intrusive thoughts .88 -.81 MCS Depression Helgeson & Lepore (2004)
.31* Change in Prostate-specific Function Change in Self-Esteem Depression Agency .23* .48*** -.55*** .76 .61 Bowel Urine Helgeson & Lepore (2004)
Which explanation accounts for the “Gender Paradox”? Health Behaviors Men’s mortality Social Role Factors Women’s morbidity