Download
1 / 30
310 likes | 838 Views
Single-Subject Research. Single-subject research usually involves collecting data on one subject at a time. Single-subject researchers generally use line graphs to illustrate the effect of their intervention. . Created by Del Siegle for EPSY 5601 del.siegle@uconn.edu www.delsiegle.info.

E N D
Single-Subject Research Single-subject research usually involves collecting data on one subject at a time. Single-subject researchers generally use line graphs to illustrate the effect of their intervention. Created by Del Siegle for EPSY 5601 del.siegle@uconn.edu www.delsiegle.info
Suppose a researcher wished to investigate the effect of praise Baseline Praise
Suppose a researcher wished to investigate the effect of praise on reducing disruptive behavior Baseline Praise 8 7 6 5 4 3 2 1 0 Frequency of disruptions
Suppose a researcher wished to investigate the effect of praise on reducing disruptive behavior over many days. Baseline Praise 8 7 6 5 4 3 2 1 0 Frequency of disruptions 0 1 2 3 4 5 6 7 8 9 10 11 12 13 14 15 16 Day
Suppose a researcher wished to investigate the effect of praise on reducing disruptive behavior over many days. First she would need to establish a baseline of how frequently the disruptions occurred. Baseline 8 7 6 5 4 3 2 1 0 Frequency of disruptions 0 1 2 3 4 5 6 7 8 9 10 11 12 13 14 15 16 Day
Suppose a researcher wished to investigate the effect of praise on reducing disruptive behavior over many days. First she would need to establish a baseline of how frequently the disruptions occurred. She would measure how many disruptions occurred each day Baseline Praise 8 7 6 5 4 3 2 1 0 Frequency of disruptions 0 1 2 3 4 5 6 7 8 9 10 11 12 13 14 15 16 Day
Suppose a researcher wished to investigate the effect of praise on reducing disruptive behavior over many days. First she would need to establish a baseline of how frequently the disruptions occurred. She would measure how many disruptions occurred each day Baseline Praise 8 7 6 5 4 3 2 1 0 Frequency of disruptions 0 1 2 3 4 5 6 7 8 9 10 11 12 13 14 15 16 Day
Suppose a researcher wished to investigate the effect of praise on reducing disruptive behavior over many days. First she would need to establish a baseline of how frequently the disruptions occurred. She would measure how many disruptions occurred each day Baseline Praise 8 7 6 5 4 3 2 1 0 Frequency of disruptions 0 1 2 3 4 5 6 7 8 9 10 11 12 13 14 15 16 Day
Suppose a researcher wished to investigate the effect of praise on reducing disruptive behavior over many days. First she would need to establish a baseline of how frequently the disruptions occurred. She would measure how many disruptions occurred each day Baseline Praise 8 7 6 5 4 3 2 1 0 Frequency of disruptions 0 1 2 3 4 5 6 7 8 9 10 11 12 13 14 15 16 Day
Suppose a researcher wished to investigate the effect of praise on reducing disruptive behavior over many days. First she would need to establish a baseline of how frequently the disruptions occurred. She would measure how many disruptions occurred each day Baseline Praise 8 7 6 5 4 3 2 1 0 Frequency of disruptions 0 1 2 3 4 5 6 7 8 9 10 11 12 13 14 15 16 Day
Suppose a researcher wished to investigate the effect of praise on reducing disruptive behavior over many days. First she would need to establish a baseline of how frequently the disruptions occurred. She would measure how many disruptions occurred each day for several days. Baseline Praise 8 7 6 5 4 3 2 1 0 Frequency of disruptions 0 1 2 3 4 5 6 7 8 9 10 11 12 13 14 15 16 Day
Suppose a researcher wished to investigate the effect of praise on reducing disruptive behavior over many days. First she would need to establish a baseline of how frequently the disruptions occurred. She would measure how many disruptions occurred each day for several days. In the example below, the target student was disruptive seven times on the first day Baseline Praise 8 7 6 5 4 3 2 1 0 Frequency of disruptions 0 1 2 3 4 5 6 7 8 9 10 11 12 13 14 15 16 Day
Suppose a researcher wished to investigate the effect of praise on reducing disruptive behavior over many days. First she would need to establish a baseline of how frequently the disruptions occurred. She would measure how many disruptions occurred each day for several days. In the example below, the target student was disruptive seven times on the first day, six times on the second day Baseline Praise 8 7 6 5 4 3 2 1 0 Frequency of disruptions 0 1 2 3 4 5 6 7 8 9 10 11 12 13 14 15 16 Day
Suppose a researcher wished to investigate the effect of praise on reducing disruptive behavior over many days. First she would need to establish a baseline of how frequently the disruptions occurred. She would measure how many disruptions occurred each day for several days. In the example below, the target student was disruptive seven times on the first day, six times on the second day, and seven times on the third day. Baseline Praise 8 7 6 5 4 3 2 1 0 Frequency of disruptions 0 1 2 3 4 5 6 7 8 9 10 11 12 13 14 15 16 Day
Once a baseline of behavior has been established (when a consistent pattern emerges with at least three data points), the intervention begins. Baseline Praise 8 7 6 5 4 3 2 1 0 Frequency of disruptions 0 1 2 3 4 5 6 7 8 9 10 11 12 13 14 15 16 Day
Once a baseline of behavior has been established (when a consistent pattern emerges with at least three data points), the intervention begins. The researcher continues to plot the frequency of behavior Baseline Praise 8 7 6 5 4 3 2 1 0 Frequency of disruptions 0 1 2 3 4 5 6 7 8 9 10 11 12 13 14 15 16 Day
Once a baseline of behavior has been established (when a consistent pattern emerges with at least three data points), the intervention begins. The researcher continues to plot the frequency of behavior while implementing the intervention of praise. Baseline Praise 8 7 6 5 4 3 2 1 0 Frequency of disruptions 0 1 2 3 4 5 6 7 8 9 10 11 12 13 14 15 16 Day
In this example, we can see that the frequency of disruptions decreased once praise began. Baseline Praise 8 7 6 5 4 3 2 1 0 Frequency of disruptions 0 1 2 3 4 5 6 7 8 9 10 11 12 13 14 15 16 Day
In this example, we can see that the frequency of disruptions decreased once praise began. The design in this example is known as an A-B design. Baseline Praise 8 7 6 5 4 3 2 1 0 Frequency of disruptions 0 1 2 3 4 5 6 7 8 9 10 11 12 13 14 15 16 Day
In this example, we can see that the frequency of disruptions decreased once praise began. The design in this example is known as an A-B design. The baseline period is referred to as A Baseline Praise 8 7 6 5 4 3 2 1 0 Frequency of disruptions 0 1 2 3 4 5 6 7 8 9 10 11 12 13 14 15 16 Day
In this example, we can see that the frequency of disruptions decreased once praise began. The design in this example is known as an A-B design. The baseline period is referred to as A and the intervention period is identified as B. Baseline Praise 8 7 6 5 4 3 2 1 0 Frequency of disruptions 0 1 2 3 4 5 6 7 8 9 10 11 12 13 14 15 16 Day
In this example, we can see that the frequency of disruptions decreased once praise began. The design in this example is known as an A-B design. The baseline period is referred to as A and the intervention period is identified as B. A B Baseline Praise 8 7 6 5 4 3 2 1 0 Frequency of disruptions 0 1 2 3 4 5 6 7 8 9 10 11 12 13 14 15 16 Day
Another design is the A-B-A design. An A-B-A design (also known as a reversal design) involves discontinuing the intervention and returning to a baseline. Baseline Praise Baseline 8 7 6 5 4 3 2 1 0 Frequency of disruptions 0 1 2 3 4 5 6 7 8 9 10 11 12 13 14 15 16 Day
Another design is the A-B-A design. An A-B-A design (also known as a reversal design) involves discontinuing the intervention and returning to abaseline. A B A Baseline Praise Baseline 8 7 6 5 4 3 2 1 0 Frequency of disruptions 0 1 2 3 4 5 6 7 8 9 10 11 12 13 14 15 16 Day
Sometimes an individual’s behavior is so severe that the researcher cannot wait to establish a baseline and must begin with an intervention. In this case, a B-A-B design is used.The intervention Praise 8 7 6 5 4 3 2 1 0 Frequency of disruptions 0 1 2 3 4 5 6 7 8 9 10 11 12 13 14 15 16 Day
Sometimes an individual’s behavior is so severe that the researcher cannot wait to establish a baseline and must begin with an intervention. In this case, a B-A-B design is used. The intervention is followed by a baseline Praise Baseline 8 7 6 5 4 3 2 1 0 Frequency of disruptions 0 1 2 3 4 5 6 7 8 9 10 11 12 13 14 15 16 Day
Sometimes an individual’s behavior is so severe that the researcher cannot wait to establish a baseline and must begin with an intervention. In this case, a B-A-B design is used. The intervention is followed by a baseline followed by the intervention. Praise Baseline Praise 8 7 6 5 4 3 2 1 0 Frequency of disruptions 0 1 2 3 4 5 6 7 8 9 10 11 12 13 14 15 16 Day
Sometimes an individual’s behavior is so severe that the researcher cannot wait to establish a baseline and must begin with an intervention. In this case, a B-A-B design is used. The intervention is followed by a baseline followed by the intervention. B A B Praise Baseline Praise 8 7 6 5 4 3 2 1 0 Frequency of disruptions 0 1 2 3 4 5 6 7 8 9 10 11 12 13 14 15 16 Day
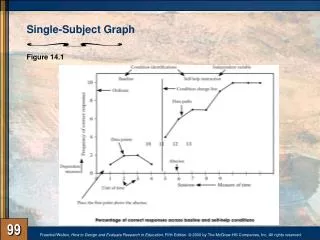
Regardless of the research design, the line graphs used to illustrate the data contain a set of common elements. Condition identifications Independent variable Dependent measure Baseline Praise 8 7 6 5 4 3 2 1 0 Condition change line Frequency of disruptions Data points Ordinate Data path Abscissa 0 1 2 3 4 5 6 7 8 9 10 11 12 13 14 15 16 Unit of time Day Measure of time
Regardless of the research design, the line graphs used to illustrate the data contain a set of common elements. Please read Chapter 14 in your text to learn more about Single-Subject Research and other Single-Subject Research Designs. Condition identifications Independent variable Dependent measure Baseline Praise 8 7 6 5 4 3 2 1 0 Condition change line Frequency of disruptions Data points Ordinate Data path Abscissa 0 1 2 3 4 5 6 7 8 9 10 11 12 13 14 15 16 Unit of time Day Measure of time