Download
1 / 29
290 likes | 562 Views
Geographical Information System (Dam and Watershed Analysis ). Kumar Digvijay Singh 02D05012. Under Guidance of Prof. Milind Sohoni. Outline. Watershed delineation Sinks, flat areas, flow direction, delineation etc. Dam Construction

E N D
Geographical Information System (Dam and Watershed Analysis) Kumar Digvijay Singh 02D05012 Under Guidance of Prof. Milind Sohoni
Outline • Watershed delineation • Sinks, flat areas, flow direction, delineation etc. • Dam Construction • Visualization and Calculation of Storage and Catchment • Parameters regarding dam and field usage • Demo. of tool
Introduction • What is GIS? • GRAM++: • GIS package developed by CSRE, IIT Bombay. • Software with modules of Map editing, Raster analysis, Terrain Modeling, Watershed delineation. • Objectives of project.
Watershed • Total area of water flowing towards an outlet point (Pour point). • Water flows in the direction of the terrain steepest downhill slope. Streamlines (blue arrows) are orthogonal to the contour lines. • Drainage line (red line) are found along the highest points of the terrain.
DEM • Digital Elevation Models (DEM) are grids of elevation. • Contour maps are converted to digital contour files and elevation values are interpolated from irregularly spaced points to regular grid points. • Watershed delineation can be based on DEMs rather than contour lines.
Digitizing the Map • Map models: • Raster Model • Tin Model • Methods of digitizing: • Digitizing through spot heights • Digitizing through contour maps/toposheets • Input map for our tool is in the form of raster grid, with each cell value being elevation above mean sea level.
Watershed Delineation • Removing sink: • Sink or depression is a cell or a group of cell which is at a lower elevation than all its neighboring cells. • Convert sink to flat area by increasing the height of sink to minimum height of neighbor. • Remove flat areas: • A cell is said to be part of a flat area, if all of its neighbors have the same elevation as itself, or a higher elevation. • Each cell identified as being part of a flat area is incremented by a small increment
Watershed Delineation • Flow Directions: • The eight-direction pour point algorithm (D-8) assigns a flow direction code to each cell, based on the steepest downhill slope as defined by the DEM. • The flow direction code indicates the cell towards which the water flows. • Flow direction is calculated by comparing the distance weighted drop of neighboring cells. Flow direction codes
Watershed Delineation • Flow Accumulation: • Flow accumulation is a measure of the drainage area in units of grid cells. • The flow accumulation value of a cell is the sum of the flow accumulation values of the neighboring cells and the number of neighboring cells which flow into it. Transforms to
Watershed Delineation • Apply Threshold: Threshold is given to find out all pixels having a flow accumulation value above a certain value. The value is supplied by the user and the flow of water in drainage is calculated on the basis of this threshold. • Pour Point. • Watershed delineation around the drainage.
Dam Construction/Visualization • End point is selected by the user and a line is drawn between these end points to give a view. • Various parameters given by user: • Aspect Ratio • Width of top of dam • Height of dam( < Maximum height) • Foundation depth • The elevation of each point is increased and the resultant DEM is stored as a raster image.
Storage Calculation • Find all those cells that will be covered by water after dam construction. • A 2-D array corresponding to the cells of DEM with each cell having a value from -1,0,1,2. • Value assigning scheme: -1 = end cells of image. 0 = Cell that is not in storage area. 1 = cell currently processing 2 = cell in the storage area.
Storage Calculation • Initially assign all cells except border cells a value 0. • Start with a single cell in area and recursively go on visiting all those neighbor cells which are connected to this cell and are at height lesser than dam height. • Give all the visited neighbor a value 2 and color these neighbors, showing the storage.
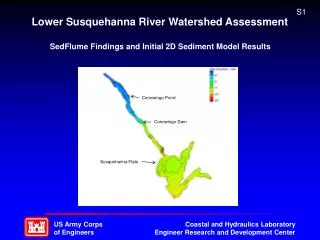
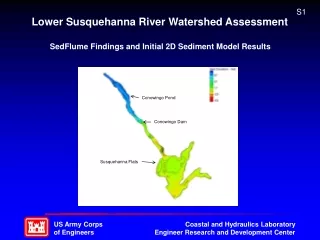
Storage Visualization Raster Map of Gudwan area Before Dam construction Storage with Dam
Storage Visualization • Data Collection Limitation: • Null Values for unknown points giving a low value outside the considered area.
Catchment Visualization • Catchment is defined as area through which inflow of water occurs into the dam. • The inflow will be towards a cell if neighboring cell have FD value as in figure:
Catchment Visualization • Assign a 2-D array corresponding to the cells of DEM as values: -1 = Border cells of image. 0 = The cell that is not in catchment area 1 = Currently processing cell 2 = cell in catchment area 3 = cell in storage area 4 = cell with dam constructed • All those cell whose inflow is towards any of storage cell ( excluding the dam cells) will contribute towards the catchment area.
Dam Calculations • Volume Calculation: • Consider the cross section of dam as above figure
Dam Calculations • Volume Calculation: • Cross section area is: W( H + f ) + B( H + 2f ) Where: • W = width of top of dam • H = Elevation of dam above mean sea level – Elevation of cell before dam. • f = foundation depth • B = base of dam = (H’ / AS) • AS = Aspect ratio • H’ = Maximum height of dam from the ground • Length of dam can be calculated by using end points and scale factor for dam.
Dam Calculations • Volume Calculation: • The volume contribution of each cell for dam: • Vc = Length/ (number of cells) • Therefore volume is given as: V = sum( W ( Hi + f ) + (H’/AS)( Hi + 2f) )Vc Where Hi = height difference of each cell
Dam Calculations • Surface Area Calculation: • The perimeter of cross-section is given as: PM = W + 2(slant height) Where, slant height is the length of inclined surface of dam. • SA = sum( W + 2( Slant height of each cell) )Vc • For both , the volume and the surface area the scale factor can be found from the header information of raster image.
Dam Calculations • Spill Height: • Requirements • Flow rate at the bottom of dam • Velocity of water at bottom of dam • Dam inflow rate ( Maximum volume of incoming water at peak rainfall ) • Number of spill ways • Taking the incoming water flow rate as Vmax = (n.h.d( v2 – 2.g.D)1/2)
DEMO • Some of the visual Images After dam construction:
Error Possibilities • The exact contribution of each pixel can’t be found which may lead to some errors. • Variation of Scale factor. • Number of cells with increased heights. • Error in volume and surface area calculation.
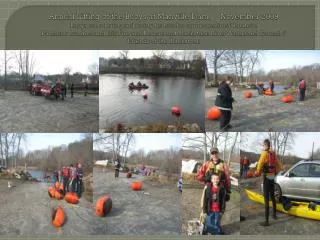
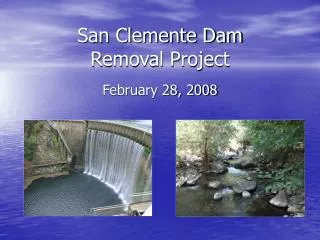
Field Work • During the course of this project we have analyzed the work of construction of check dam in the areas of Gudwanwadi and Belachiwadi of Karjat area. • The severe water storage problem of Karjat Taluka of Raigad district. • The detailed description for the dam construction can be found at: http://www.cse.iitb.ac.in/~ctara
Conclusion • With the help of this visual tool a rough estimate of water storage and various parameters of dam can be found. • Future Scope: Automatic location of optimal dam site for a given map.
References • Ian Heywood, Sarah Cornelius, Steve Carver. An Introduction to Geographical Information System. Pearson Education Press, 2003. • P.Venkatachalam, B.Krishna Mohan, Amit Kotwal , Vikas Mishra,V.Muthuramakrishnan and Mayur Pandya. Automatic delineation of watersheds for hydrological application. • Robert J. Fowler and James J.Little. Automatic extraction of Irregular Network Digital terrain models, ACM 1979. 4. Andy Mitchell. The ESRI Guide to GIS Analysis. Environmental System Research Institute, California 1999.