Download
1 / 29
290 likes | 511 Views
Climate change, air quality, and health. Lead: Catherine Karr, MD PhD MS University of Washington Department of Pediatrics/Env & Occ Health Sciences ckarr@u.washington.edu

E N D
Climate change, air quality, and health Lead: Catherine Karr, MD PhD MS University of Washington Department of Pediatrics/Env & Occ Health Sciences ckarr@u.washington.edu Co-investigators (UW associated): J. Elizabeth Jackson, Richard Fenske, Michael Yost, Cole Fitzpatrick, Roger Rosenblatt Co-investigators (WSU associated): Brian Lamb, Serena Chung, Jack Chen, Jeremy Avise How did I get here?
Outline The Conceptual Model (qualitative) climate change → regional air quality regional air quality → adverse health outcomes A “first step” Regional Public Health Risk Assessment (quantitative)
Climate Change & Air Quality The influence of meteorology on air quality is substantial and well-established
Atmospheric processes Moderating influences Increased respiratory symptoms & illness Regional Meteorology Atmospheric concentrations of pollutants • Exacerbated • chronic heart & • lung aging • Accelerated lung • aging • Increased lung • cancer risk • Increased risk of • premature death Heat waves Temperature Precipitation Extreme weather Climate change O3 PM SO2 NO2 CO Human- generated emissions natural & human caused Natural emissions Aeroallergens Amount, timing & distribution Allergic Diseases Asthma Rhinitis Adaptive measures Research (Bernard et al. EHP 2001;109:199)
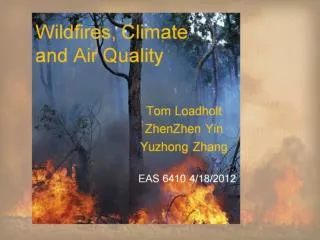
Meteorology & PM2.5 Higher temperatures in PNW would likely increase the frequency of favorable conditions for wildfires, a source of PM2.5 pollution (McKenzie et al., 2004; Littell 2006)
Meteorology & Pollen There is growing evidence that elevated temperatures contribute to a longer pollen season and increased allergenicity of some pollens (Beggs, 2004)
Form of oxygen – O3 Not emitted into the atmosphere, but created there: O2 + NOx + VOCs + + Ozone (O3) (↑ evaporative VOCs from fuel injected autos with ↑ temperature) Meteorology & Air Pollution: ↑ temperature → ↑ ground level ozone
Ozone toxicity Damage airway epithelial cells which results in inflammation, an increase in nonspecific airway reactivity, and an increase in epithelial permeability. Reduced immune defense against respiratory infections. Human Studies • Upper and lower Airway irritation • Pulmonary inflammation • Wheezing and breathing difficulties during exercise or outdoor activities • Aggravation of asthma • Increased susceptibility to respiratory illnesses like pneumonia and bronchitis • Asthma prevalence in children?
Climate Change → Air Quality & Health Current Evidence Base (quantitative models) Limited….. Most focus on ozone formation (most robust connection to future climate/increased temperature) Generally, ↑ T → ozone Pollen data includes experimental & observational Few PM2.5 projection data, variable effects Most health impact assessments assess mortality as endpoint Most are global summaries (rather than regional)
Quantitative analysis: Background Estimate deaths due to ozone in mid-century for King and Spokane County Ozone = priority pollutant of concern in WA, most clearly linked with increased temp/climate change Premature Mortality Most serious outcome Most accessible/accurate Robust evidence base linking ozone and mortality – multiple locations (US and non US)
Methods: Study Region King Co, Spokane Co • 2 “case studies” • Represent impacts in two densely populated eastern/western Washington populations with distinct climatologic zones.
Methods: Risk Assessment Model M(time period-location) = (P/100,000) ×B × DR × E M - deaths attributable to ozone (mortality) P – Population B – Baseline mortality rate DR – dose-response (increase in mortality per increase in ozone) E- Estimated O3 concentrations in each county (baseline and mid century decade of 2000s) (adapted from Knowlton et al. Environ Health Perspect 2004;112:1557–1563)
Methods: P (population) • Baseline decade (1997-2006) and mid century projected population – WA • Source: WA Office of Financial Management
Methods: B (baseline mortality rate) • Daily deaths rate for King and Spokane County (baseline decade 1997-2006) • Source: WA State Dept of Health
Methods – E (exposure) Estimate current (baseline) decade and projected mid century) 8 hour maximum average O3 (ppb): warm season May-Sept E1997-2006 + Δ = E2045-2055 WA State Dept of Ecology: 1997-2006 data from monitoring network for King/Spokane Co. “Baseline” decade daily average was calculated (E1997-2006) WSU modeling:Derive estimated change in ozone concentrations from baseline decade to mid-century (Δ)
Based on climate models – what is projected change in ozone concentration in mid century? Dr. Brian Lamb & colleagues (WSU) Comprehensive model: PCM (Parallel Climate Model)5, MOZART-2 (Model for Ozone and Related Chemical Tracers v.2), MM5 (Mesoscale Meteorological model), CMAQ (Community Multi-scale Air Quality model). Simulate: 1990–1999 (beginning of decade) and 2045– 2054 (mid decade) hourly 8 hour maximum ozone concentrations → Δ Resolution: 36-km grid cells with boundary conditions taken from the global models (abstract section overlaps Spokane and King County) 2045-2055 simulation = (IPCC) A2 scenario, business-as-usual US emission projections and projected alterations in land use, land cover (LULC) due to urban expansion and changes in vegetation.
Methods: DR (dose-response) Literature review • Landmark study of 95 large U.S. urban communities made up of almost 40% of the U.S. population -including Spokane and Seattle (Bell et al 2004. JAMA 292:2372-78) • Provides estimated national average DR of mortality (non-injury mortality and cardiopulmonary mortality) associated with average ambient ozone concentrations in 1987-2000 • Per 10 ppb ↑ daily 8 hour maximum ozone • ↑ All non traumatic mortality 0.80% (95% confidence interval 0.41%-1.18 • ↑ cardiopulmonary-specific mortality 0.98% (0.47%- 1.50%)
Results Modeling framework to estimate “delta” (estimated change in ozone in 2045-2055) +5.8 ppb in King County +6.1 ppb in Spokane County Monitoring data for current decade • 8 hour average maximum daily ozone concentrations in May-September • King County 20.7 ppb • Spokane County 35.5 ppb
Conclusions ↑ projected mid century ozone →↑ projected ozone mortality in Spokane & King Counties Higher ozone concentrations and higher underlying mortality rates in Spokane Co. yielded higher current and mid century ozone related mortality Higher projected relative change from current to mid century ozone in King Co yielded higher relative ↑ in ozone mortality rate
Public Health stakes of climate change response: Losing ground…or gaining speed • Overall, ambient air concentrations of ozone and particulate matter have improved in the last decades due to control of emissions • If no response to mitigate: will climate change compromise this progress? • Or will action to address climate change deliver added value of improved air quality for WA state?
Thank you ckarr@u.washington.edu
Research Needs Discussion • What additional climate information/research would be advantageous for future planning? • What information/research serves our understanding of how to ameliorate or mitigate the impacts of climate change?
Research needs: climate change & heat stress • How is health care utilization affected during heat events? (e.g., hospitalizations, emergency department visits) • What is impact of heat wave on population subgroups with differing vulnerability? • Especially: Individuals in poverty or who live in low-income neighborhoods • Rural populations • Racial and ethnic minorities • Explore possibility of small-area analysis to more closely link heat extremes with mortality • Explore need for and potential efficacy of recommended adaptation measures
Research Needs: climate change & air quality • Develop range of climate ozone projections reflecting varied assumptions re: population growth, emission changes, land use changes • How does future policy making influence these? • What is impact on other health outcomes? (e.g. respiratory hospitalization, asthma prevalence, cardiovascular disease events) • What are impacts on population subgroups with differing vulnerability? • Develop robust regional scale projections for PM2.5 and apply to health risk studies
Research needs • Assess climate change impacts on public health via food and water borne illness, vector born disease, traumatic injury due to extreme weather events