Download
1 / 48
480 likes | 677 Views
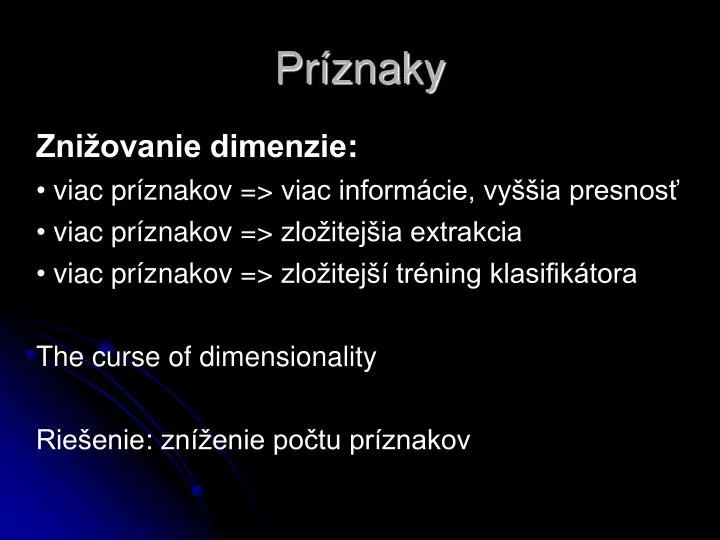
Pr íznaky. Znižovanie dimenzie : • viac príznakov = > viac informácie, vyššia presnosť • viac príznakov = > zložitejšia extrakcia • viac príznakov = > zložitejší tréning klasifikátora The curse of dimensionality Riešenie : zníženie počtu príznakov. Výber príznakov :

E N D
Príznaky • Znižovanie dimenzie: • • viac príznakov => viac informácie, vyššia presnosť • • viac príznakov => zložitejšia extrakcia • • viac príznakov => zložitejší tréning klasifikátora • The curse of dimensionality • Riešenie: zníženie počtu príznakov
Výber príznakov: • vyberieme podmnožinu • Redukcia príznakov: • transformujeme pôvodnú množinu do menej-dimenzionálnej
Typy algoritmov • Zoradenie príznakov podľa vhodnosti • - ohodnotenie jednotlivých príznakov • identifikácia relevantnýchpríznakov, nevyhodnocuje sa nadbytočnosť príznakov • Hľadanie vhodnej podmnožiny • - ohodnotenie podmnožín príznakov • identifikácia minimálnejpodmnožiny príznakov, implicitne sa vyhodnocuje nadbytočnosť príznakov • 2dpodmnožín d príznakov
Výber príznakov • Filter • Separating feature selection from classifier learning • Relying on general characteristics of data (information, distance, dependence, consistency) • No bias toward any learning algorithm, fast
Zoradenie príznakov podľa vhodnosti • ohodnotenie jednotlivých príznakov • výber najlepších • Výhody • Efektívnosť • Ľahká implementácia • Nevýhody • ťažko určiť vhodný prah • neuvažuje sa vzťah medzi príznakmi
Výber vhodných príznakov • Forward1: Npríznakov s najvyšším skóre • Forward2: • 1.vyber príznak s najvyšším skóre • 2. – prerátaj skóre zvyšných príznakov • – opakuj, kým nevyberieš N príznakov
Výber príznakov • Backward1: Z množiny príznakov odstráň N príznakov s najnižším skóre • Backward2: • 1. Z množiny príznakov odstráň príznak s najnižším skóre • 2. – prerátaj skóre zvyšných príznakov • – opakuj, kým neodstrániš N príznakov
Hodnotiace miery • Miery vhodnosti príznakov • Filter: • Konzistencia • Medzitriedna vzdialenosť • Štatistická závislosť • Informačno-teoretickémiery • Wrapper: • Prediktívna schopnosť množiny trénovacích príznakov (kvalita rozpoznávania pre testovacie dáta) • krížová validácia
Konzistencia • Podmnožina príznakov musí separovať triedy tak konzistentne ako celá množina • Nekonzistencia, ak objekty s rovnakými príznakmi patria rôznym triedam
Štatistická závislosť Korelačný keoficient Nekorelovanosť ≠ nezávislosť Iba ak X a Y majú normálne rozdelenie Závislosť →štatistická nadbytočnosťzdrojových dát
-p*log(p)-(1-p)*log(1-p) Informačno-teoretickémiery
Entropia X = College Major Y = Likes “XBOX” log2 H(X) = 1.5 H(Y) = 1
Špecifická podmienená entropia X = College Major Y = Likes “XBOX” H(Y |X=v) = entropia len týchY, X=v H(Y|X=Math) = 1 H(Y|X=History) = 0 H(Y|X=CS) = 0
Podmienená entropia X = College Major Y = Likes “XBOX” H(Y|X) = priemerná špecifická podmienená entropiaY = ΣjP(X=vj) H(Y | X = vj) H(Y|X) = .5
Vzájomná informácia X = College Major Y = Likes “XBOX” Ako sa znížia nároky (počet bitov) na prenos informácie Y, ak odosielateľ aj prijímateľ poznajú X? I(Y|X) = H(Y) - H(Y |X) • H(Y) = 1 • H(Y|X) = 0.5 • I(Y|X) = 0.5
Výber príznakov Wrapper Relying on a predetermined classification algorithm Using predictive accuracy as goodness measure High accuracy, computationally expensive
Wrapper Learning algorithm is a black box computes objective function OF(s) Účelová funkcia Exhaustive search 2d possible subsets Greedy search is common and effective Genetic algorithms …
Hľadanie optimálnej podmnožiny Forward selection Initialize s={} Do: Add feature to s which improves OF(s) most While OF(s) can be improved Backward elimination Initialize s={1,2,…,n} Do: remove feature from s which improves OF(s) most While OF(s) can be improved Backward elimination tends to find better models too expensive to fit the large sets at the beginning of search Both can be too greedy.
Ohodnotenie podmnožiny We’re not ultimately interested in training error; we’re interested in test error (error on new data). We can estimate test error by pretending we haven’t seen some of our data. Keep some data aside as a validation set. If we don’t use it in training, then it’s a fair test of our model.
K-fold cross validation Rozdeľ dáta na K skupín Každú skupinu použi na validáciu Zisti priemernú chybu X7 X1 X6 test Learn X2 X5 X3 X4
K-fold cross validation Rozdeľ dáta na K skupín Každú skupinu použi na validáciu Zisti priemernú chybu X7 X1 X6 Learn X2 test X5 X3 X4
K-fold cross validation Rozdeľ dáta na K skupín Každú skupinu použi na validáciu Zisti priemernú chybu X7 X1 X6 Learn X2 test … X5 X3 X4
K-fold cross validation Rozdeľ dáta na K skupín Každú skupinu použi na validáciu Zisti priemernú chybu X7 X1 X6 OF Learn X2 X5 X3 X4
Feature Reduction Algorithms • Unsupervised (minimize the information loss) • Latent Semantic Indexing (LSI): truncated SVD • Independent Component Analysis (ICA) • Principal Component Analysis (PCA) • Manifold learning algorithms (a manifold is a topological space which is locally Euclidean) - Nonlinear • Supervised (maximize the class discrimination) • Linear Discriminant Analysis (LDA) • Canonical Correlation Analysis (CCA) • Partial Least Squares (PLS)
Principal Component Analysis (PCA) Karhunen-Loeve or K-L method PCA finds the best “subspace” that captures as much datavariance as possible Based on eigen-decomposition of data covariance matrix Very simple! Data can be represented as linear combination offeatures
PCA • otočí súradnicovú sústavu tak, aby prvá os bola v smere najväčšej variability a ďalšie boli na ňu kolmé v smeroch najväčšej zvyšnej variability. nová ortonormálna báza
Very Nice When Initial Dimension Not Too Big • What if very large dimensional data? • Images e.g., (d ~104) • Problem: • Covariance matrix Σ is size (d x d) • d=104| Σ | = 108 • Singular Value Decomposition (SVD) to the rescue!
SVD Singulárne číslo a singulárne vektory matice pre reálne matice
Vzťah medzi PCA a SVD použitie SVD namiesto PCA
ICA (Independent Components Analysis) • Relaxes the constraint of orthogonality but keeps the linearity. Thus, could be more flexible than PCA in finding patterns.
PCA is not always an optimal dimensionality-reduction procedure for classification purposes. • PCA is based on the sample covariance which characterizes the scatter of the entire data set, irrespective of class-membership. • The projection axes chosen by PCA might not provide good discrimination power.
Linear Discriminant Analysis (LDA) What is the goal of LDA? • Perform dimensionality reduction “while preserving as much of the class discriminatory information as possible”. • Seeks to find directions along which the classes are best separated. • Takes into consideration the scatter within-classesbut also the scatter between-classes.
Fisherova lineárna disriminačná analýza • riadená metóda • využíva informáciu o klasifikačných triedach
PCA is first applied to the data set to reduce its dimensionality. LDA is then applied to find the most discriminative directions:
Case Study: PCA versus LDA • A. Martinez, A. Kak, "PCA versus LDA", IEEE Transactions on Pattern Analysis and Machine Intelligence, vol. 23, no. 2, pp. 228-233, 2001. Is LDA always better than PCA? • There has been a tendency in the computer vision community to prefer LDA over PCA. • This is mainly because LDA deals directly with discrimination between classes while PCA does not pay attention to the underlying class structure. • Main results of this study: • (1) When the training set is small, PCA can outperform LDA. • (2) When the number of samples is large and representative for each class, LDA outperforms PCA.
Nevýhody LDA? LDA is a parametric method since it assumes unimodal Gaussian likelihoods If the distributions are significantly non-Gaussian, the LDA projections will not be able to preserve any complex structure of the data, which may be needed for classification LDA will fail when the discriminatory information is not in the mean but rather in the variance
Deficiencies of Linear Methods Data may not be best summarized by linear combination of features