Download
1 / 33
340 likes | 452 Views
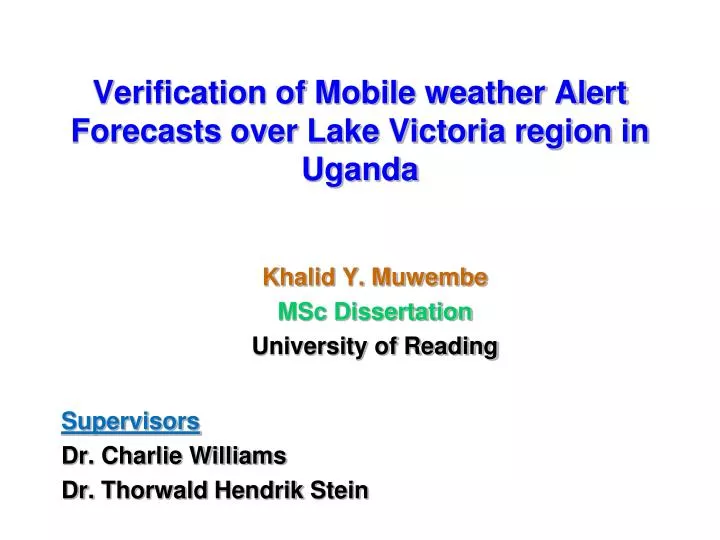
Verification of Mobile weather Alert Forecasts over Lake Victoria region in Uganda . Khalid Y. Muwembe MSc Dissertation University of Reading Supervisors Dr. Charlie Williams Dr. Thorwald Hendrik Stein. Background.

E N D
Verification of Mobile weather Alert Forecasts over Lake Victoria region in Uganda Khalid Y. Muwembe MSc Dissertation University of Reading Supervisors Dr. Charlie Williams Dr. ThorwaldHendrik Stein
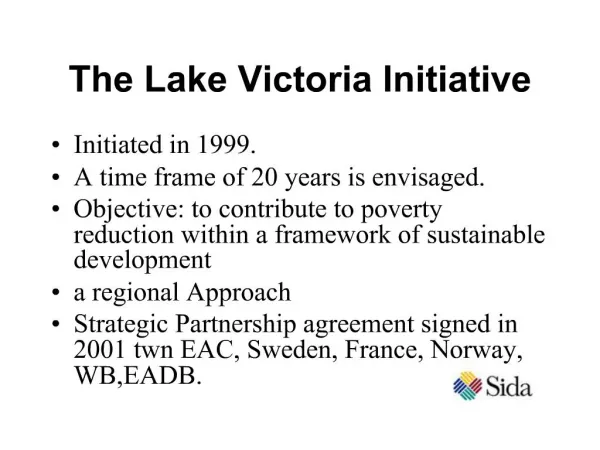
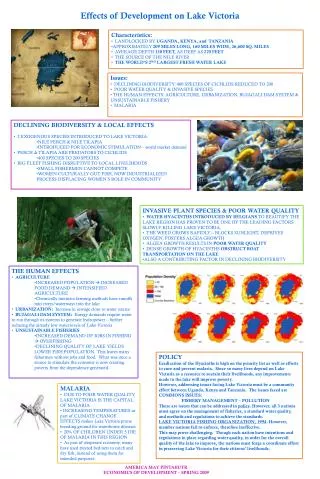
Background • The frequent recurrence of severe storms continues to threaten the safety of marine navigation over Lake Victoria since a large number of boats use the lake on a daily basis to sustain a thriving fishing industry. • Hundreds of people lose their lives on the lake each year, with a proportion of these are related to storm conditions. • The importance of the lake as a resource that supports community livelihood is growing and so is the need to provide weather forecasts and warnings to fishermen and other vessels using the lake for the safety of navigation.
Motivation • Given the rough weather conditions common over the lake, there was need for regular weather warnings to ensure safety of marine operations. • The MWA Service was designed to help fishermen avoid dangerous weather hazards that may cause fatal accidents over the lake. • Issuing the weather forecasts is one step and the other would be the trust that fishermen attach to these forecasts which in turn depends on the accuracy and reliability of the warnings issued.
Objective • Verification of daily weather forecasts for Mobile Weather Alert (MWA) against observed storm events for period February – April 2012. • Assessment of the forecasting tools available to operational forecasting at UDoM • Recommendations on how to improve the forecasting tools/process at UDoM.
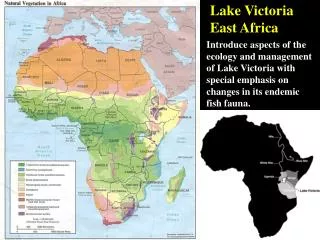
Study area Fig 1: Topographic map of Uganda and location within Africa. Source: Wileyonlinelibrary.com/journal/met Fig 2: Major Islands with active fisheries over Lake Victoria. Source: Google Maps
Annual cycle of rainfall Annual precipitation cycle of three (3) Coastline stations within 50km of Kalangala Islands
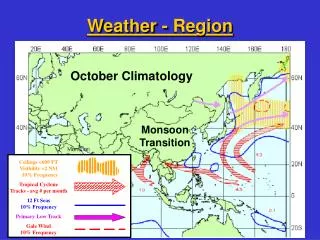
Diurnal cycle of convection • Deep convection peaks over the lake in the early hours of the morning and dissipates in the afternoon • Evening peak in convection over land north-east of the lake and to the east.
Operational 4-km Lake Victoria model • The 4km model over Lake Victoria has same science configuration as “Extended UK4” model but located in East Africa. • The 4km model is run operationally twice a day at 00 UTC and 12 UTC, out to T+48 hours, with a time step of 100 seconds. • The model has 70 levels in the vertical, but only extends from the surface to 40 km, providing greater resolution in the boundary layer. • All forecast model fields are available to operational forecasters online
Case study: 4-km Lake Victoria performance on convective storms • Chamberlain and Bain ( 2012) verified the Lake Victoria model performance on a case study of a storm that occurred on 1 March 2012 around 1930 LT (1630 UTC). • This storm event and associated high waves in the Buvuma region led to a boat capsizing, killing 7 passengers and crew with few people surviving (http://allafrica.com/stories/201203120163.html) • Satellite observations showed the storm developing between 12 UTC and 15 UTC on 1 March NE of the lake (Buvuma) and dissipated by 18 UTC although by then there were signs of new convective activity south of the original storm.
Verification of storm • Various model fields were analysed in both the high resolution (4-km) and global (25-km) models over the Lake Victoria region. • From results of this case study, the global model showed an increase in wind intensity compared to that of both the mean and the calm day fields when a storm was present • However, the strength of the winds did not exceed the red warning threshold of 20 kts for mean wind speed or 30kts for wind gusts
Results from 4-km model • Most fields showed an increased intensity over the mean state and the calm day state when a storm was present. • The spatial accuracy of this forecast appeared to be good since the storm was developing in this area at 1200 UTC. • The results further showed that both models appear to be identifying an increased storm risk 12 hours before the storm starts to develop. • It was concluded that the high resolution model adds value to the forecast from the global model by capturing the features of the event more clearly
Satellite imagery on 1st March 4-km Lake Victoria model T+12 Global unified model T+12
Verification of the Mobile Weather Alert forecasts Data sources • MWA forecasts from UDoM • Lightning data from recent convection storm study over L. Victoria by UK Met Office international team (Chamberlain and Bain, 2012). • TAMSAT satellite algorithm data used due to absence of rain-gauge observations over the lake. Available dekadal rainfall estimates were downscaled to daily RFE estimates using Daily RFE = (dekadal RFE / dekadal CCD) * daily CCD • Rain-gauge records from stations along the lake coastline sourced from UDoM
Verifying TAMSAT daily RFE with rain-gauge records from Entebbe and Makerere • RFE and rain-gauge R= 0.813 Entebbe R=0.796 Makerere • Significance tests for correlations done at 95% level. • The correlation is significant at both stations with p-values of 0.006 and 0.002 for Entebbe and Makerere respectively. R = 0.813 R = 0.796
The Contingency table and verification measures • Forecast performance measures and scores used in the study are computed from 4 elements of the table, hits, false alarms, misses, and correct rejections. Performance measures used are • Frequency bias index (FBI) • Proportion Correct (PC) • Critical success Index (CSI) • Equitable threat score (ETS) • True Skill Statistic (TSS) • Five rainfall observation thresholds were used in this study to calculate the verification scores; 0.1mm (obs), 2mm, 5mm, 10mm and 20mm
Determining the rainfall thresholds • Observations and forecasts analysed to determine thresholds. • Top left most obs near zero considered light showers ~2mm_T • Top right Most obs between 0 – 10mm considered moderate showers ~5mm_T • Bottom left most Obs between 10 – 20mm considered heavy showers ~10mm_T • Anything beyond 20mm considered severe showers ~20mm_T
Monthly forecast performance False alarms are fewer during the drier month of February compared to March and April. This could be attributed to fewer storm forecasts issued during a dry month. However, a higher number of misses is observed as the occasional storms are not forecasted.
Performance measure variations at different thresholds • Hits and misses reduce with increasing rainfall threshold • False alarm decreases with increasing rainfall threshold
Forecast success rate • Hits plus CR (correct rejections) are the successful forecasts while false alarm and miss indicate unsuccessful forecasts. Around 70% success rate against ARF and RFE, however lower success rate against ATD
Frequency bias • February is dry month, the FBI was computed for the entire 3 month period as well as a period minus the dry month (February). • Including dry month forecasts – tendency of over-forecasting and without dry month under-forecasting at higher thresholds
Critical Success Index and Proportion Correct • Forecasts capture heavy storms fairly well – high values of PC/POD • Does not include CR– CSI basically depict reliability of forecast system
Verification scores • At higher value thresholds, both ETS and TSS computed scores are higher, indicating highest forecasting skill. • The scores for both ETS and TSS are lowest for persistence forecast (depicted as “persist”) implying that “persistence forecast” is less skilful when verified against either of the observation data sets.
Discussion of results • The verification results from the analyses indicate that there are no substantial differences in skills of the forecasting system when verified against either averaged rainfall or RFE. • Observation thresholds are used in the study in response to the hazard thresholds criteria that the MWA forecast system uses to categorise the forecasts issued in accordance with established hazard alert criteria
Using PC/POD • The PC measure is important since forecasting calm days (correct rejection) is equally critical to fishermen using the MWA forecasts in making decisions on when to going-out fishing on the lake. • High PC scores determine the confidence forecast users (fishermen) attach to the MWA forecasts they receive on daily basis. • High PC scores indicates how forecast system forecasts storm days as well as calm days and every time we get it correct builds the integrity of the service by users
Using CSI • Plots of CSI shows at both lower and higher thresholds, CSI values are moderate indicating the forecasting system is “reliable” but demonstrate no special skills in forecasting light or severe storms. • For “persistence forecast”, CSI values are lower depicting “less reliability” of the persistence when verified against either of the observation data.
Using ETS and TSS • ETS and TSS show measures of accuracy of the forecast • Both scores show that the forecast system has better skills at the higher observation threshold values, but the scores are slightly lower at lower thresholds implying poor forecast skill in forecasting light storms. • Therefore results indicate that forecasters are able to predict the severe storms
Recommendations to improve the forecasting • Development of hazard indicators from the model products • Extreme forecast index for all fields • Hazard diagnostics for lightning, wind gusts, extreme rainfall indicators and wind shear to determine convection type and severity. • Improving observations over the lake • Already plans have been finalised to install AWS on 2 ferries operating over Lake Victoria • Improving configuration of the 4km Lake Victoria Model • Operational training for forecasters
Summary • TSS and ETS are the best scores for verifying the MWA forecasts since both measures indicate that the forecast system has skill in predicting severe storms as well as calm days. • Forecasts show good hit rate for both storm and calm days. This is reflected in the high values of PC/POD – more so for higher threshold observations. • Better results are anticipated using actual gauge observations over the lake.
They look keen on our service Accurate and reliable weather information will save lives