Download
1 / 34
340 likes | 474 Views
Oct 13, 2008. Weather Quiz Review Stability Clouds Force Balances. Oct 20 Forecast. Jet Stream Rainfall/Temperature. Last Week’s Forecast 500 mb. Forecast. Actual. Last week’s Forecast. Actual. Forecast. What Causes Air to Rise???. Frontal Lifting. Orographic Lifting.

E N D
Oct 13, 2008 • Weather • Quiz • Review Stability • Clouds • Force Balances
Oct 20 Forecast Jet Stream Rainfall/Temperature
Last Week’s Forecast500 mb Forecast Actual
Last week’s Forecast Actual Forecast
What Causes Air to Rise??? Frontal Lifting Orographic Lifting Convergence
Adiabatic Process • Assumed: A parcel of air does not mix with its environment and does not exchange heat energy with its environment • Rising parcels expand and cool • Descending parcels compress and heat • If a parcel rises or descends adiabatically you can predict is temperature using the ADIABATIC lapse rate
Lapse Rate • Rate at which temperature changes with altitude Idealized Lapse Rates • Dry adiabatic lapse rate is 10C per km • Moist adiabatic lapse rate is 6C per km Environmental Lapse Rate • Measured Lapse Rate (e.g. RAOB)
Why Is Moist Adiabatic Lapse Rate Lower Than Dry? • Moist air means saturation…RH=100% • When moist air rises and cools, condensation occurs • Condensation means vapor liquid • Higher energy rate to lower energy rate • Excess energy is used to heat the parcel at a rate of 4 C/km • Dry adiabatic cools 10 C/km therefore Moist adiabatic is 6 C/km (difference of 4 C/km) • Remember…adiabatic process…no heat loss to outside of parcel
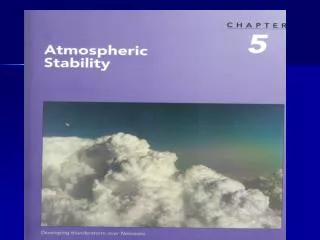
Stability… Compare the temperature of air inside a rising parcel to the surrounding environment • A parcel of air isless dense than its environment if it is warmer than the environment…it is therefore unstable and will rise on its own (free convection) So storm clouds (convective clouds) form when the atmosphere is unstable, and rising motions occur because parcels of lifted air age UNSTABLE
Lifting Condensation Level • The level where saturation first occurs in a lifted parcel of air • A parcel rises at the Dry Adiabatic lapse rate before saturation, Moist Adiabatic after saturation.
Level of Free Convection • When a parcel of air is warmer than its environment it is less dense (buoyant) and rises freely • The level buoyancy occurs is the level of free convection
The Four Forces of Atmospheric Motion • Pressure Gradient Force • Friction • Gravity • Coriolis Force • First three are called fundamental forces because they occur whether the earth is rotating or not. The Coriolis force is an ‘apparent’ force and results from the earth’s rotation. It is a REAL force though and affects the direction of the wind.
Pressure Gradient Force • ‘Wind’ is the average motion of air molecules • Surface pressure is measured in millibars • Lines of equal surface pressure are called isobars • Pressure gradient is the rate pressure changes with distance • The force applied to a parcel of air due to a pressure gradient is called the pressure gradient force
Examples of Pressure Gradient Force • California Delta sea-breezes • Hurricanes • Strong winter storms
NoCal Pressure Gradient Examples • Reference weather stations • Eureka (EKA) • SF Airport (SFO) • Red Bluff (RBL) • Sacramento (SAC) • We Look at: • EKA-SFO • RBL-SAC • SFO-SAC EKA RBL SAC SFO
Typical Strong Wind Situations for NoCal • Strong winter storm • EKA-SFO= -18 to -22 mb SFO winds 60-80 mph (light a candle…your lights are out) • Average winter storm • EKA-SFO= -12 to -18 mb SFO winds 30-50 mph • Strong sea breeze • SFO-SAC= 3 to 5 mb Travis winds SW @30-40 mph (good wind energy day) • Strong north winds • RBL-SAC= 8 to 12 mb Travis winds NE 20-40 mph (good fire weather day) EKA RBL SAC SUU SFO SUU=Travis AFB
Gravitational Force • Any two elements are attracted to each other by gravity…strength of attraction depends on the relative size of the masses, and their distance apart • The earth and a parcel of air follow this rule, but the earth is much more massive • The gravitational force at the bottom and top of the troposphere is essentially the same…why?? • The direction of the gravitational force is always toward the center of the earth
Coriolis Force • An ‘Apparent’ force • Due to rotation of earth • Does not change speed • Changes wind direction • Strongest for fast flow • Minimum (zero) at equator • Maximum at pole • Deviates to right in NH
Coriolis Effect on Atmospheric Circulations • Curvature of the tracks of hurricanes, typhoons, and cyclones worldwide shows the opposite effect of the Coriolis force in the either hemisphere
Frictional Force • Always acts in opposite direction to the direction of flow • Changes wind speed not direction
Frictional Forces • The depth of the friction boundary layer effects depends on: • surface roughness • surface heating • atmospheric stability • wind speed • How do each of the above affect the depth of the boundary layer • Boundary layer height ranges from hundreds (night) to a few thousand meters (day) • Why???????????
Frictional Effects • Friction retards wind speed near the surface • Lowering the coriolis force • Therefore, wind direction is altered from parallel to isobars.
Force Balances • Air motions are driven by pressure differences due to uneven solar heating across the earth’s surface • Exact balance is never achieved…but in the attempt to achieve…many interesting weather phenomena develop
Hydrostatic Balance • Upward pressure gradient is strong…but air does not escape • Downward gravitational force equalizes upward pressure gradient force • That is called hydrostatic balance. • Occasional large deviations to this balance occur during thunderstorms
Geostrophic Balance • The balance between pressure gradient force and Coriolis force above the boundary layer is called geostrophic balance • In the ideal case…pressure surface heights would be equally spaced and straight for this to happen • But atmosphere is in ‘general’ geostrophic balance
Idealized Steps to Geostrophic Balance This illustration is on a horizontal plane (500 mb map)
Idealized Cyclonic Flow (No Friction) • Lows are called cyclones, therefore flow around them is “cyclonic” and around high pressure “anti-cyclonic”.
Frictional Effects • Friction retards wind speed near the surface • Lowering the coriolis force • Therefore, wind direction is altered from parallel to isobars.
500 MB Height Surface • Jet stream patterns are (troughs and ridges) are easily identifiable at the 500 mb region • 500 millibars is a pressure surface and typically ranges from 5000 to 6000 meters above ground level • 5000-6000 meters equals 500-600 decameters (dm) • Meteorologists often refer to the 500 mb height as an indicator of heat wave or strong winter storms • In California, our strongest heat waves occur when the 500 mb height is between 590-600 dm (July heat wave) • Our strongest (and coldest storms) occur when the 500 mb height is between 520-530 dm (SF snow events)
The Slope of the 500 mb Surface Also Shows Where the Strongest Jet Stream Winds Are Where the slope of the 500 mb surface is greatest, winds are greatest…
500 mb Map L 516 dm H 590 dm