Download
1 / 57
610 likes | 763 Views
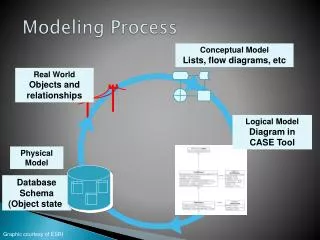
Data and Process Modeling. Overview. What the system does what an event occurs: activities and interactions Traditional structured approach to representing activities and interactions Diagrams and other models of the traditional approach

E N D
Overview • What the system does what an event occurs: activities and interactions • Traditional structured approach to representing activities and interactions • Diagrams and other models of the traditional approach • Customer support system example shows how each model is related
Data Flow Diagrams • Graphical system model that shows all main requirements for an IS in one diagram • Inputs / outputs • Processes • Data storage • Easy to read and understand with minimal training
DFD and Levels of Abstraction • Data flow diagrams (DFDs) are decomposed into additional diagrams to provide multiple levels of detail • Higher level diagrams provide general views of the system • Lower level diagrams provide detailed views of the system • Differing views are called levels of abstraction
Context Diagrams • DFD that summarizes all processing activity • Highest level (most abstract) view of system • Shows system boundaries • System scope is represented by a single process, external agents, and all data flows into and out of the system
Identifying Events • Can be difficult to determine • Often confused with conditions and responses • May be useful to trace a transaction’s life cycle • Certain events left to design phase • Systems controls to protect system integrity
Sequence of Actions that Lead up to Only One Event Affecting the System
Sequence of “Transactions” for One Specific Customer Resulting in Many Events
Example Events • Important external events involve customers • Customer checks item availability, customer places order, customer changes or cancels order • Other external events involve departments • Shipping fulfills order, marketing sends promotion to customer, merchandising updates catalog • Temporal events include periodic reports • Time to produce order summary reports, Time to produce fulfillment summary reports
DFD Fragments • Created for each event in the event table • Represents system response to one event within a single process symbol • Self contained model • Focuses attention on single part of system • Shows only data stores required to respond to events
Event-Partitioned System Model • DFD to model system requirements using single process for each event in system or subsystem • Decomposition of the context level diagram • Sometimes called diagram 0 • Used primarily as a presentation tool • Decomposed into more detailed DFD fragments
Decomposing DFD Fragments • Sometimes DFD fragments need to be explored in more detail • Broken into subprocesses with additional detail • DFD numbering scheme: • Does not equate to subprocess execution sequence • It is just a way for analyst to divide up work
Physical and Logical DFDs • Logical model • Assumes implementation in perfect technology • Does not tell how system is implemented • Physical model • Describes assumptions about implementation technology • Developed in last stages of analysis or in early design
Evaluating DFD Quality • Readable • Internally consistent • Accurately represents system requirements • Reduces information overload: Rule of 7 +/- 2 • Single DFD should have not more than 7 +/-2 processes • No more than 7 +/- 2 data flows should enter or leave a process or data store on a single DFD • Minimizes required number of interfaces
Data Flow Consistency Problems • Differences in data flow content between a process and its process decomposition • Data outflows without corresponding inflows • Data inflows without corresponding outflows • Results in unbalanced DFDs
Consistency Rules • All data that flows into a process must: • Flow out of the process or • Be used to generate data that flow out of the process • All data that flows out of a process must: • Have flowed into the process or • Have been generated from data that flowed into the process
Documentation of DFD Components • Lowest level processes need to be described in detail • Data flow contents need to be described • Data stores need to be described in terms of data elements • Each data element needs to be described • Various options for process definition exist
Data Dictionary • A data dictionary, or data repository, is a central storehouse of information about the system’s data • An analyst uses the data dictionary to collect, document, and organize specific facts about the system • Also defines and describes all data elements and meaningful combinations of data elements
Data Dictionary • A data element, also called a data item or field, is the smallest piece of data that has meaning • Data elements are combined into records, also called data structures • A record is a meaningful combination of related data elements that is included in a data flow or retained in a data store
Data Dictionary • Documenting the Data Elements • You must document every data element in the data dictionary • The objective is the same: to provide clear, comprehensive information about the data and processes that make up the system
Data Dictionary • Documenting the Data Elements • The following attributes usually are recorded and described • Data element name or label • Alias • Type and length • Default value • Acceptable values - Domain and validity rules
Data Dictionary • Documenting the Data Elements • The following attributes usually are recorded and described • Source • Security • Responsible user(s) • Description and comments
Data Dictionary • Documenting the Data Flows • The typical attributes are as follows • Data flow name or label • Description • Alternate name(s) • Origin • Destination • Record • Volume and frequency
Data Dictionary • Documenting the Data Stores • Typical characteristics of a data store are • Data store name or label • Description • Alternate name(s) • Attributes • Volume and frequency
Data Dictionary • Documenting the Processes • Typical characteristics of a process • Process name or label • Description • Process number • Process description
Data Dictionary • Documenting the Entities • Typical characteristics of an entity include • Entity name • Description • Alternate name(s) • Input data flows • Output data flows
Data Dictionary • Documenting the Records • Typical characteristics of a record include • Record or data structure name • Definition or description • Alternate name(s) • Attributes
Data Dictionary • Data Dictionary Reports • Many valuable reports • An alphabetized list of all data elements by name • A report describing each data element and indicating the user or department that is responsible for data entry, updating, or deletion • A report of all data flows and data stores that use a particular data element • Detailed reports showing all characteristics of data elements, records, data flows, processes, or any other selected item stored in the data dictionary
Structured English • Method of writing process specifications • Combines structured programming techniques with narrative English • Well suited to lengthy sequential processes or simple control logic (single loop or if-then-else) • Ill-suited for complex decision logic or few (or no) sequential processing steps
Decision Tables and Decision Trees • Can summarize complex decision logic better than structured English • Incorporates logic into the table or tree structure to make descriptions more readable