Download
1 / 35
350 likes | 575 Views
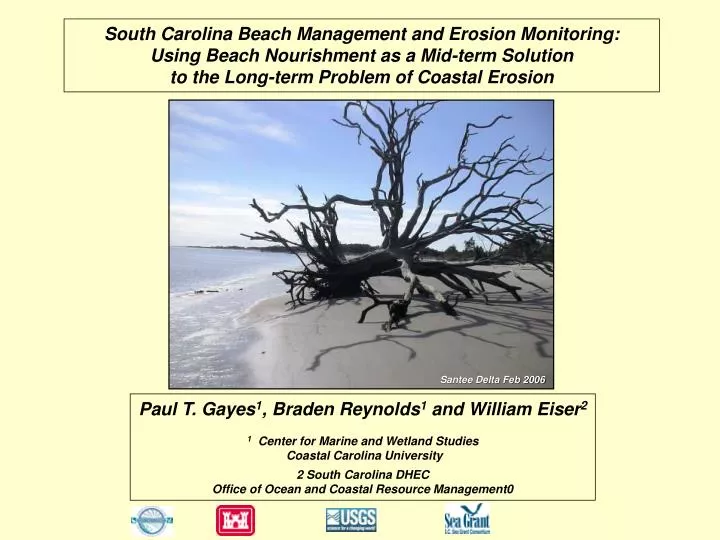
South Carolina Beach Management and Erosion Monitoring: Using Beach Nourishment as a Mid-term Solution to the Long-term Problem of Coastal Erosion. Santee Delta Feb 2006. Paul T. Gayes 1 , Braden Reynolds 1 and William Eiser 2 1 Center for Marine and Wetland Studies

E N D
South Carolina Beach Management and Erosion Monitoring: Using Beach Nourishment as a Mid-term Solution to the Long-term Problem of Coastal Erosion Santee Delta Feb 2006 Paul T. Gayes1, Braden Reynolds1 and William Eiser2 1 Center for Marine and Wetland Studies Coastal Carolina University 2 South Carolina DHEC Office of Ocean and Coastal Resource Management0
Myrtle Beach Sept 2004 Cape Romaine Sept 2004 Arcadian Shores Sept 2004 Overview Local Expression of National Issues Evolution of State Retreat Policy Initial Implementation Renourishment- The Mid-Term Strategy The Approach of the Mid-Term Morris Island Lighthouse June 2005 Santee Delta Feb 2006
1977-1988 Change by any definition of shoreline • Limited jurisdiction • Critical line set at the scarp line, or at the landward toe of the primary dune • No jurisdiction landward of this line • Seawalls routinely permitted Garden City 1992 Morris Island Lighthouse June 2005
1987 Blue Ribbon Committee • Studied the effects of unregulated development and the proliferation of seawalls • Recommended changes to the CZMA
1988 BeachfrontManagement Act (BMA) • Implemented recommendations of the Blue Ribbon Committee • Created two new lines of jurisdiction • Baseline methodology for standard zones (natural and armored), and inlet zones (stabilized and unstabilized) • Setback line dependent on erosion rate
Landward most position of the shoreline in 40 yrs • Eroded vegetation line on aerial photos • Crest of the Primary Dune • Defined -Beach Surveys • Shore parallel contours INLET HAZARD ZONES STANDARD ZONES OCRM 2000 Baseline OCRM 2000 Baseline
Armored / Developed Shorelines Washout Area Folly Beach, SC (1996) Debordieu Beach, SC (2006) Pawleys Island, SC (2006)
2000 OCRM Baseline Jurisdictional Line Based on Volume and Morphology Rather Than a Shoreline Much of System Below Waterline Lidar doesn’t penetrate well in SC
BERM Beach Survey Program 1993-Present • Developed by CMWS through co-operative • program between USGS and SC OCRM • Capture complete active beach • 2000 Shifted to RTK-DGPS • >2002CMWSUSGS/Sea Grant/OCRM/Local Coop
Baseline updated every 10 yrs. • Long Term = Retreat Policy Set-Back Line 40 x annual erosion rate Base Line
1988 BMA Restrictions • No construction seaward of the baseline • No new seawalls • Existing seawalls, if destroyed, could be replaced with sloping structures 10’ from the building foundation • All vertical seawalls to be removed after 30 years, and replaced with sloping structures
Hurricane Hugo, 1989Initial Challenges Natural • Many destroyed houses rebuilt farther landward, behind the baseline (Urban/suburban renewal) • Destroyed seawalls replaced with sloping structures 10’ from building foundation
1989 Lucas LawsuitEarly Legal Challenges • Lucas lots were totally seaward of the baseline, unbuildable under 1988 BMA • Lucas sued, claiming a taking • Case went to US Supreme Court, which ruled in his favor in 1992 and remanded the case for damages
1990 Revisions to BMA • Construction seaward of the baseline could now be authorized under a “special” permit • No larger than largest, never >5,000 s.f. • As far landward as practical, no farther seaward than neighboring houses • Never on primary dune or active beach • No seawall as part of foundation • If the house is ever located on the active beach, it must be removed* • Destroyed seawalls could not be rebuilt • DBR threshold at 80% in 1990, 66 2/3% in 1995, 50% in 2005 • 30-year time limit on vertical walls eliminated
1992 Lucas Lawsuit Resolution • While courts were determining damages, settled out of court • State issued 2 special permits to Lucas • State purchased lots for $425k each, plus $725k awarded ($1.575M total) • State sold lots, transferred permits • Lots were built on in 1995 and 1998 “Lucas Lot”
South Carolina State Policy Remains Essentially a Retreat Policy Some tightening – Seawall Provision Some Loosening- Special Permit In Practice… Implementation and Associated Thorny Issues… Delayed by Extensive Beach Nourishment…. “Mid-term Solution…to Long Term Issue” SC Nourishments North Myrtle Beach Arcadian Shores Myrtle Beach Surfside Beach Garden City Beach Pawleys Island Debordieu Folly Beach Edisto Island Hunting Island Hilton Head
Measures of Success of Nourishment Projects Storm Protection Basis of Fed Authorization Height/Volume/Width of Dune/Backshore Volume/Width/Height Nearshore Bars Slopes/Modeling/Hazards Indicators Property Loss North Myrtle Beach March 1993 “Storm of the Century”
Economic Tourism Basis of State/Local Support Width of Subaeria/Intertidal Beach Stability/Planning Visitors/Property Values Public Access Crowding vs. Desirability “ I originally bought on the second row believing erosion patterns to be too high a risk on the front row.. Considering the way property values have skyrocketed… If I could do it all over again.. I would have bought on the front row” Folly Beach Resident, 2006
Morphologic Wet/Dry Line MHW Contour Profile Volumes Widths/Slopes Total Project vs Hot Spots Construction Footprint Alongshore vs. Offshore loss Harris and Tinker : Web Interface for Berm Data
Washout 1995 March 2006 Holiday Inn Seawall Pre-2006 Nourishment Post 2006 Nourishment Pre-1993 Nourishment Folly Beach Example 1993 Nourished Source Folly River ~7 yr Interval Modest Design Storm (5 yr event) 2005-06 Renourished Source Offshore Similar Design
Two Opposing views of the 1993 Folly Beach Nourishment “Width of Subaerial Beach” ‘An unmitigated disaster’ ‘An Unqualified Engineering Success’ a famous coastal engineer (1995; paraphrased) a famous coastal geologist (1995; paraphrased)
A case for one view point Charleston County Park South End – Folly Beach 1986 1988 1990 1992 1994 1996 1998 2000 2002 2004 2006 95 96 97 98 99 00 01 02 03 04 05
2005 Pre-Renourishment A case for better than expected 94 95 96 97 98 99 00 01 02 03 04 05 06
1992 Pre-Nourishment 1993 Post-Nourishment 2005 Pre-Renourishment2006 Post Renourishment
1992 Pre-Nourishment 1993 Post-Nourishment 2005 Pre-Renourishment2006 Post Renourishment
1992 Pre-Nourishment 1993 Post-Nourishment 2005 Pre-Renourishment2006 Post Renourishment
OCRM Baseline-MWH Win Some Lose Some MHW Volume relative to pre-1993 Total Project Volume 1993-2005 39% Remaining Above MHW
Volume (cu yd/ft) -10’ Volume relative to pre-1993 Total Project Volume 1993-2005 46% Remaining Above MHW
Folly Experience Sand Volumes/Contours Nearly half of the sand placed is within system after 13 years (2x planned interval: numerous tropical/winter storms) High Tide Beach Localized Hotspots Failure of the southern end Park Poor Retention at Washout Holiday Inn better than expected Structures at Risk Ones constructed seaward of front row after 1993 project ~Successful by most indicators Bottom Line is nearly twice expected renourishment Interval “Success of nourishment is in the eye of the beholder….”
Myrtle Beach Sept 2004 Arcadian Shores Sept 2004 State/Local Policy Implications Approaching Mid-Term at Variable Speeds (erosion rates 0-m’s/yr) Density and Economy (ability to pay) of Development also Variable Question will likely ultimately be forced in private communities funding nourishment from their own pockets Holding the Line in a State Park/Resort Hunting Island Case Frequent Nourishments Consideration of groins Funding Federal/State/Local/Private SC Nourishment Fund (Established) Infrequent Appropriation into fund (not annualized)
Surfside/Garden City Borrow Site, After Gayes et al., 2001 “Federal Sands” Bottom Video Off Pawleys Island Natural Resource Issues Offshore Sands Limits Habitat Issues Construction Costs Expected to Increase Public/Private Benefits will also continue to Increase While Delaying Choice..Big Dollar Issues will become Bigger Dollar Issues
How Long is Mid-Term? Sea Level – “The Low County” Drainage Water / Quality Issues Storms-Little Protection from “The Big One” Risk/Value Informed Societal Decisions Myrtle Beach Storm Drain Construction-2005
Long Term Retreat Policy Long Term Make/Defend Land Policy Primary Dike Netherlands “Buy land... There not making any more of it…” A wise parent, 1987
Summary South Carolina Has Been Holding Course- Retreat Policy Relatively Smooth Sailing While Enforcement Isn’t Triggered Assumed Event Would Trigger (Lessons from Katrina) Court Challenges are over the Horizon Takings and Technical Issues Initial Steps Towards Operationally Funding Mid-Term Solution Little Progress on What Happens Post-Mid Term