Download
1 / 17
190 likes | 334 Views
Fundamentals of Data Analysis Lecture 6 Testing of statistical hypotheses pt.3. Nonparametric test. Nonparametric tests can be divided into two groups : tests of goodness of fit , allowing to test the hypothesis that the population has a certain type of distribution ,

E N D
Fundamentals of Data AnalysisLecture6Testing of statisticalhypothesespt.3
Nonparametric test • Nonparametric tests can be divided into two groups: • tests of goodnessof fit, allowing to test the hypothesis that the population has a certain type of distribution, • tests of the hypothesis that two samples come from one population(ie, that the two populations have the same distribution).
Kolmogorov test of goodness of fit In Kolmogorovλ test of goodness of fit issuitable for veryfication of thehypothesisthatpopulationhasspecifieddistribution. Duringthat test the empirical distribution function iscompared tothe hypotheticalone, not as in the chi-square test, wherethe size of empirical series was culculatedand compared withthesize of hypotheticalseries. In fact, when the population distribution is consistent with the hypothesis ,the value of empirical and hypothetical distribution should be similar in all examined points.
Kolmogorov test of goodness of fit The test starts with the analysis of the differences between the two distribution functions, the largest of which will be used then for the construction of lambda statistics whose distribution does not depend on the form of a hypothetical distribution. This distribution determines the critical value for this test. If the maximum difference at some point in the area of the characteristic variability is too high, the hypothesis that the distribution of the population has the cumulative distribution as we suspectshould be rejected.
Kolmogorov test of goodness of fit The usefulness of this test is limited, because the hypotheticaldistribution must be continuous, we should also know the parameters of this distribution, but in the case of large samples theycan be estimated from the sample.
Kolmogorov test of goodness of fit The procedure for the Kolmogorov test is as follows: 1 we sort the results in ascending or group them in a relatively narrow ranges, withrightendsxiand correspondingsizesni; 2. For eachxiwe calculateempiricalcumulativedistributionFn(x) withtheaid of equation:
Kolmogorov test of goodness of fit 3. from a hypothetical distribution for each xiwe determine the theoretical value of the distribution function F(x); 4. For eachxiwe calculatethe absolute value of the differenceFn(x)-F(x); 5. We calculatetheparameterD = sup|Fn(x)-F(x)| and thenthevalue of specialstatistics: which, when null hypothesis istrue should have the Kolmogorov distribution.
Kolmogorov test of goodness of fit 6. for a certain level of confidence awe read from Kolmogorov distribution critical value satisfying condition P{llcr} = 1 - a. Whenllkrthenullhypothesisshould be rejected, otherwise there is no reason to reject the null hypothesis.
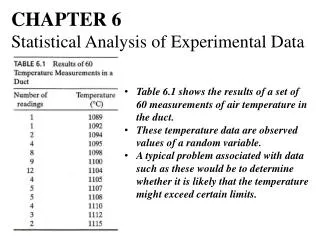
Kolmogorov test of goodness of fit Example The sample of size n = 1000 were tested and the results are grouped into 10 narrow classesand included in the table. Our task is to extend the reasonable null hypothesis for the distribution and verify it on the level of confidence equal to 95%. Class Size
Kolmogorov test of goodness of fit Example • Size distribution is close to symmetric, the maximum is at one of the middle classes, which raises the hypothesis that the distribution of the tested attribute is a normal distributionN(m, s) • If we were to take m=65, theninsidetherange <63.0; 67.0> thereare1000-(25+19) = 956 results, whatgives 95.6% of allresults. • From properties of the normal distribution, we know that the probability of adopting the values within the rangefromu-1.96s to u+1.96sisequal to 95% (thismeanthat for 1000 samplesprobe 950 samplesshould be insidethatrange).
Kolmogorov test of goodness of fit Example • Thus, a reasonable hypothesis seems to be s = 1 • Ournullhypothesisis H0: N(65,1)
Kolmogorov test of goodness of fit Example • In the third column the distribution function values are placed whichwerecalculated by:
Kolmogorov test of goodness of fit Example • In the fourth column we place theright ends of standardized classes(x - m)/s • in the fifth column arethe values of distribution functionread from the tables of N(0, 1) distribution • in the sixth column the absolute values of differences between the distribution functionsareplaced, the largest of which isd4 = 0,0280
Kolmogorov test of goodness of fit Example • then we calculate sqrt(n) dn = sqrt(1000) · 0,0280 = 0,886 • For a confidencelevel0,95 we read from the Kolmogorov distribution tables a critical value lcr = 1,354 • in the sixth column the absolute values of differences between the distribution functionsareplaced, the largest of which isd4 = 0,0280
Kolmogorov test of goodness of fit Example • Critical value is greater than the calculated value, so the test results do not contradict the null hypothesis that the distribution of the general population is normalN(65, 1)
Kolmogorov test of goodness of fit Exercise • Thecapacity of 40 capacitors was measured(in pF): 55.1; 67.3; 54.6; 52.2; 58.4; 50.4; 70.1; 55.3; 57.6; 62.5; 68.4; 54.5; 56.7; 53.5; 61.6; 59.6; 49.0; 63.7; 58.1; 56.7; 57.8; 63.6; 69.2; 60.8; 62.9; 54.3; 61.0; 58.2; 64.3; 57.4; 39.3; 59.0; 60.1; 60.7; 59.9; 70.5; 57.2; 61.8; 46.0 • Using the Kolmogorov test ( with 95% level of significance) to find the distribution to which capacitance of the capacitorcome under.