Download
1 / 36
360 likes | 659 Views
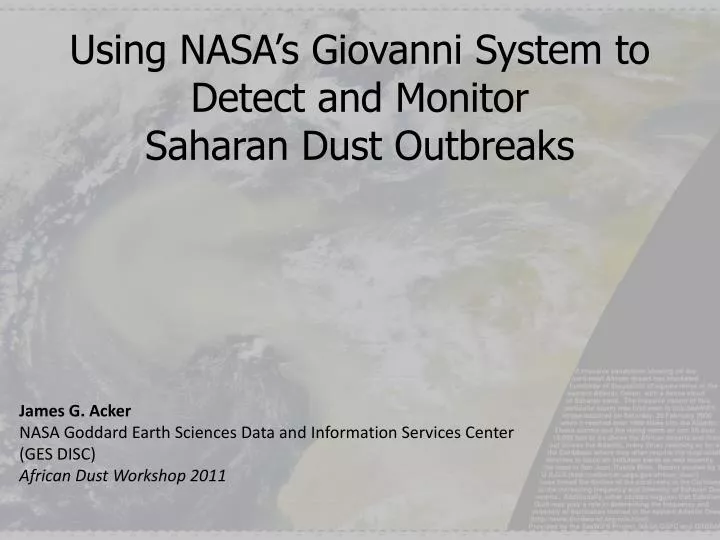
Using NASA’s Giovanni System to Detect and Monitor Saharan Dust Outbreaks. James G. Acker NASA Goddard Earth Sciences Data and Information Services Center (GES DISC) African Dust Workshop 2011. Part 1: Introduction to Giovanni.

E N D
Using NASA’s Giovanni System toDetect and Monitor Saharan Dust Outbreaks James G. Acker NASA Goddard Earth Sciences Data and Information Services Center (GES DISC) African Dust Workshop 2011
Part 1: Introduction to Giovanni First, let’s clear up some misconceptions. Giovanni is not: an Italian astronomer a boy band (like Menudo) a restaurant in Baltimore’s Little Italy, or an unfinished Mozart opera. So, then, what IS Giovanni?
Giovanni Giovanni used to stand for the Goddard Earth Sciences Data and Information Services Center (GES DISC) Interactive Online Visualization ANdaNalysis Infrastructure. But we just call it “Giovanni” now. • It’s a Web-based application • developed by the NASA GES DISC • It’s easy to use • There’s no need to learn data formats, programming, or to download large amounts of data • You get customized data analyses and visualizationswith only a few mouse clicks.
Main Elements of Giovanni • Interactive map for region-of-interest selection • Compendium of available data products for analysis • Calendrical selection of time period of interest • Menu of visualization options
Getting Started with Giovanni Select Area of Interest Select Display (info, unit) Select Parameters SelectTime Period Select Plot type Generate Visualization
Outputs: Refine/Modify Refine constraints, and edit plot preferences 24 different color palette options!
Giovanni data download page HDF, NetCDF, ASCII Data downloadchoices are here Visualization image is here
Part 2: Finding Saharan Dust Outbreaks • In this section, the use of the Giovanni system to find • occurrences of Saharan dust outbreaks will be demonstrated. • You will learn how to: • Choose a region-of-interest • Choose a time-period of interest • Select a data product for visualization • Select a visualization option • View and interpret the generated visualization • Save the visualization
Choosing a GiovanniData Portal We’re going to have a better, easier-to-use Giovanni home page very soon. So now, we’ll choose the MODIS Daily data portal. The MODIS Daily data portal has: MODIS Terra and Aqua Daily Level-3 Data Atmosphere Daily Global 1X1 Degree Products
Choosing a region-of-interest Blue Marble Borders Click-and-drag on the map MOVE ZOOM DRAW
Choosing a data product& time period Data product selection Time period selection
Choosing the visualization option • In this case, the “Time Series” option is selected from a drop-down menu. • In these steps, we have selected: • The coast of northwestern Africa as the region-of-interest; • The data parameter - Aerosol Optical Depth at 550 nanometers from MODIS • The time period January-August 2004 • The time-series visualization option • So what happens when “Generate Visualization” is clicked?
Giovanni produces this: To save any image, right-click and “Save Image As” or “Save Picture As”, or the equivalent This March 5 peak in AOD indicates a large dust storm The other peaks indicate smaller dust storms
Part 3. Visualizing (and Interpreting) Images of Saharan Dust Outbreaks Now that Giovanni has helped find a large Saharan dust outbreak in early March 2004, the next step is to use Giovanni to see what it looked like, according to the data.
But first…what did it look like from space? MODIS pseudo true color image of Saharan dust outbreak, March 2004
Back to the Giovanni interface… Adjust the region-of-interest slightly: Select the “Lat-Lon map, Time-averaged” option (very popular):
Now change the Plot Preferences: New color palette New parameter maximum value
New data parameter:MODIS “Deep Blue” AOD The MODIS “Deep Blue” aerosol optical depth data parameter allows retrieval of AOD values over bright land areas, where the standard AOD algorithm fails. Using “Deep Blue” AOD, the source areas of Saharan dust outbreaks which migrate over the Atlantic Ocean can be observed.
Deep Blue AOD, March 1-5, 1994 Approximate location of the Bodélé Depression
Deep Blue AOD animation frames, March 1-4, 2004 March 1 March 2 March 3 March 4
Deep Blue AOD animation frameMarch 5, 2004 MODIS AOD, March 5, 2004
Tracking Saharan Dust Outbreaks Using Aerosol Optical Depth and adjusting its “sensitivity”, the impact of a Saharan dust outbreak over the tropical Atlantic Ocean can be tracked. Leading edge MODIS AOD for the period March 5-15, 2004, using 1.5 as the upper bound value for the color palette.
Tracking Saharan Dust Outbreaks Upper bound value for AOD palette is now set to 0.5. It now appears that elevated AOD from the dust is affecting the West Indies.
Tracking Saharan Dust Outbreaks Same color palette range is used here; now for the period March 15-20, 2004. Higher values of AOD over the West Indies (and even Puerto Rico), and notably on the northeast coast of South America. Fire?
Where is the Saharan dust in the atmosphere? Employing the Atmospheric Infrared Sounder (AIRS) Daily data portal, we can examine the atmospheric environment of the Saharan dust outbreak.
Where is the Saharan dust in the atmosphere? Choose Vertical Profile Layers Choose Vertical Profile option
Where is the Saharan dust in the atmosphere? Dry air layer The relative humidity profile shows the dry air layer primarily between 500-600 hPa, which is 4200-5600 meters, or 13,000 – 18,000 feet. The temperature profile doesn’t provide as much information.
Where is the Saharan dust in the atmosphere? Mapping relative humidity in the 500 hPa layer shows the horizontal extent of the dry air layer.
Advanced: Latitude vs. TimeHovmöller plot As a guide, 36° N is the latitude of the Straits of Gibraltar, and 6° N is about the latitude where the West African coast turns westward. The Hovmöller plot shows occurrences of dry air off the “Saharan” coast. The dust storm we have been examining impacted this region between March 1st and March 23rd. Time Latitude
Impacts on the Caribbean Sea? We can examine chlorophyll a and sea surface temperature for February, March, and April 2004 – but there are complicating factors. The data portal used here is the Ocean Color Radiometry portal. Later this year we will have 8-day (rather than monthly) data, allowing Better discrimination of shorter-term effects. We will have both Standard Ocean Color Radiometry data parameters, and Water Quality- Related parameters, including optical properties and Euphotic Depth (1% light level).
Impacts on the Caribbean Sea? February 2004 Orinoco River outflow region
Impacts on the Caribbean Sea? March 2004
Impacts on the Caribbean Sea? April 2004 Phytoplankton growth here might be augmented by iron from dust Influence of Amazon River waters