Download
1 / 24
250 likes | 822 Views
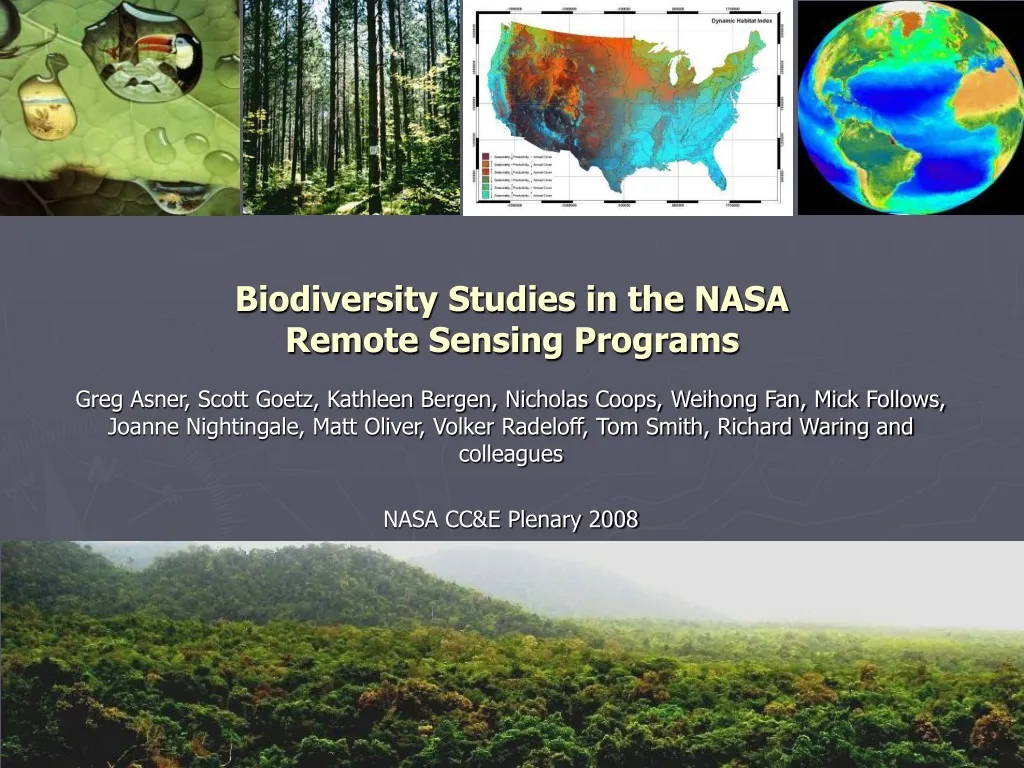
Biodiversity Studies in the NASA Remote Sensing Programs. Greg Asner, Scott Goetz, Kathleen Bergen, Nicholas Coops, Weihong Fan, Mick Follows, Joanne Nightingale, Matt Oliver, Volker Radeloff, Tom Smith, Richard Waring and colleagues NASA CC&E Plenary 2008.

E N D
Biodiversity Studies in the NASA Remote Sensing Programs Greg Asner, Scott Goetz, Kathleen Bergen, Nicholas Coops, Weihong Fan, Mick Follows, Joanne Nightingale, Matt Oliver, Volker Radeloff, Tom Smith, Richard Waring and colleagues NASA CC&E Plenary 2008
The Importance of Biological Diversity Biodiversity underpins nearly all of the services provided by ecosystems to humans • Biosphere-atmosphere interactions • Climate system • Secondary production/Fisheries • Carbon storage and loss • Water quantity and quality • Cultural, recreational, aesthetic value
Traditional Biodiversity Mapping Capabilities • Global-scale models without remote sensing • Resolution: low spatially, low taxonomically and functionally • Field-based assessments • Extent: local • Resolution: taxonomically high, spatially medium-to-high
Current Limitations • We lack regional and global knowledge of biodiversity • Extent: millions of sq. km • Resolution: high spatially and taxonomically • So what? • We don’t know what’s out there • We can't truly understand biogeochemical cycling, including water cycling • We can’t determine if diversity is changing with climate • We can’t track insipient effects of land and ocean use, and invasive species
Remote Sensing and Biodiversity Research Observed Species Richness and Abundance Correlated Species Richness and Abundance Organismal Association/Alliance Functional Types Land cover, Structure, Chemistry and Physiology Satellite and Airborne Measurements, Models, and Field Observations Remote sensing provides access to biodiversity information at scales that can’t be reached using ground-based observations alone.
Mapping Ocean Biomes from Color and Temperature Data (Aqua) Matt Oliver (U. Delaware) and colleagues Total Area of Oligotrophic Biomes Low biological productivity zones have increased in the last 5 years
MODIS Land Cover and Bear DensityVolker Radeloff and colleagues In 1990, the Soviet Union broke down, as did it’s control over eastern Europe. Since then, land use intensity has decreased, and parts of Eastern Europe are re-wilding. Bear density in 2000 MODIS Landcover
Spectral Discrimination of Plant Species (Hyperion)Phil Townsend and colleagues Hard Pine Conifers White Pine 88.3% Hemlock Red Oak 37.5% Forest Chestnut Oak 62.5% Red Oaks 86.5% Black Oak 47.6% White Oak 71.0% Broadleaf Deciduous Hardwoods Scarlet Oak 53.3% Mixed Conifer / Oaks 100% 76.9% Successional 84.6% Overall 96.5% 79.8% 59.3% Townsend and Foster 2003
Plant Functional Types from AVIRISGreg Asner and colleagues Montane Rainforest in Hawaii Volcanoes National Park Canopy Nitrogen Concentration Canopy Water Content Leaf Nitrogen Canopy Water Kilauea Iki Kilauea Iki Kilauea Volcano Kilauea Volcano 2500 mm Canopy Water 0 mm 2.5 % 0 % Leaf Nitrogen Asner and Vitousek 2005
Canopy Chemistry Invasive Species Myrica invasion front (high leaf nitrogen) Myrica infestations (high leaf nitrogen and high canopy water) Kilauea Caldera Hedychium in forest understory(high canopy water) Asner and Vitousek 2005
Bird and Plant Species Interactions and Invasion:Combining Plant Species Identification from AVIRIS with Field Bioacoustics for Birds Metrosideros polymorpha (Ohia) Morella faya (Fire Tree) - INVADER Other native species… AVIRIS Data Invaded Ecosystems Native Ecosystems Forest 100 Forest 80 AVIRIS Plant Species Cover (%) 60 40 Invaded Gradient 20 Native Gradient Savanna 0 savanna savanna forest forest shrub shrub woodland woodland Savanna Shrubland Shrubland Asner et al. 2005
Bird and Plant Species Interactions and Invasion:AVIRIS and Bioacoustics Bioacoustic Spectra Processed bioacoustic Spectra Area under acoustic frequency curve avian abundance Field-based bioacoustics station Bird diversity and the ratio of native to invasive birds is highly correlated with vegetation composition. AVIRIS Boelman et al. 2007
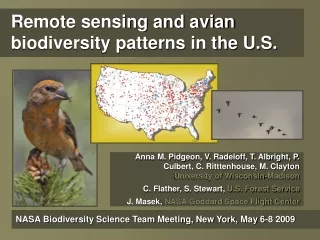
Continental-scale Bird Diversity from Terra-MODIS Data Nicholas Coops, Richard Waring and colleagues Seasonality of fPAR from MODIS, 2000-2006 Data from North American Breeding Bird Survey Coops et al. 2008
Dynamic Habitat Index Seasonality Productivity Minimum Cover Relationship between DHI and Total Bird Species Richness: r2 = 0.88, p < 0.001, n=420 species
LVIS Lidar Canopy Height Patuxent National Wildlife Refuge, MD Forest Structure and Bird Habitat from Airborne LiDAR (LVIS)Scott Goetz and colleagues From top left, clockwise: Tufted Titmouse, Brown Thrasher, Kentucky Warbler, and Carolina Wren. Photographs by Scott Somershoe, USGS. Goetz et al. 2006
Forest Structure and Bird Habitat from Airborne LiDARScott Goetz and colleagues • Breeding bird survey (BBS) grid • 5681 Individuals • 90 species • 6 guilds • Forest • Scrub/2nd Growth • Suburban • Pond/Wetland • Open-forest • Semi-open Forest Goetz et al. 2006
Bird Habitat and Diversity from Multi-sensor FusionKathleen Bergen and colleagues • Simultaneous characterization of “multi-dimensional” structure – both horizontal (landscape structure) and volumetric (biomass) • Landscape structure from optical sensors (e.g. Landsat) • Volumetric structure (i.e. biomass, height) from SAR, InSAR, and/or Lidar MODEL Landsat: land-cover composition Landsat: horizontal structure -majority -variety • SAR: • volumetric structure • -biomass Species Occurrence: point samples from field Modeling: GARP (or GLM, GAM, MaxEnt, etc) Modeled Habitat Bergen, Gilboy & Brown, 2007
Bird Habitat and Diversity from Multi-sensor FusionKathleen Bergen and colleagues Known Primary habitat: Mature conifers Secondary habitat: Younger conifers Pine Warbler • Best model included vegetation type, biomass, and patch size (> 20% improvement in accuracy over vegetation type alone) Bergen, Gilboy & Brown, 2007
Diversity Mapping for Conservation PrioritizationTom Smith and colleagues 1. 3. 2.
(c) Least suitable Most suitable Diversity Mapping for Conservation PrioritizationTom Smith and colleagues 1. 2. 3. Areas of particularly high genetic and phenotypic turnover Genetic Wedge-billed woodcreeper Phenotypic Currently protected areas
Biodiversity of Ocean Phytoplankton from Remote Sensing and Modeling Mick Follows (MIT) and colleagues • 78 initialized phytoplankton types • Random assignment of physiological traits • Simple allometric trade-offs • MIT ocean circulation model • N, P, Fe and Si cycles • 2 grazers Physical and Chemical Environment Genetics and Physiology Competition Interaction Predation Selection Self-Organizing Ecosystem Model Ecosystem Structure and Function • 99% of biomass in ~16 types
Biodiversity of Ocean Phytoplankton from Remote Sensing and Modeling Emergent biogeography – organized into functional classes Prochlorococcus analogs Synechococcus & small eukaryotes . Diatoms Other large eukaryotes Follows et al. 2007 Science
If you could build a biodiversity sensor, what would it be? Chemistry and physiology 3-D Structure Formation Flying and Integrated Data Processing High Spaceborne SAR/wLiDAR and HiFIS Temporal Resolution Integrated Airborne Imaging Spectroscopy and wLiDAR or SAR Low Geographic Scale and Resolution Small/Fine Large/Coarse
There are an increasing number of approaches to address fundamental biodiversity questions with NASA imagery. Satellite and airborne imagery help us detect unique biological patterns that help us understand underlying processes. Satellite and airborne imagery have the potential to revolutionize biogeography and make it a leading biological discipline in the 21st century (restoring some of the luster it held in the 19th century for Darwin, Wallace, Hooker, Bates, and others). We need to develop and institute tools that allow researchers to bridge the gaps in scale (and related knowledge gaps) between biome and organisms and the molecular components of organisms. Observations and associated models are our principal tools. Future missions to support biodiversity research should measure vegetation structure, plant and plankton chemistry, and physiology in a fully integrated observation approach. A Few Take-home Messages