Download
1 / 11
110 likes | 402 Views
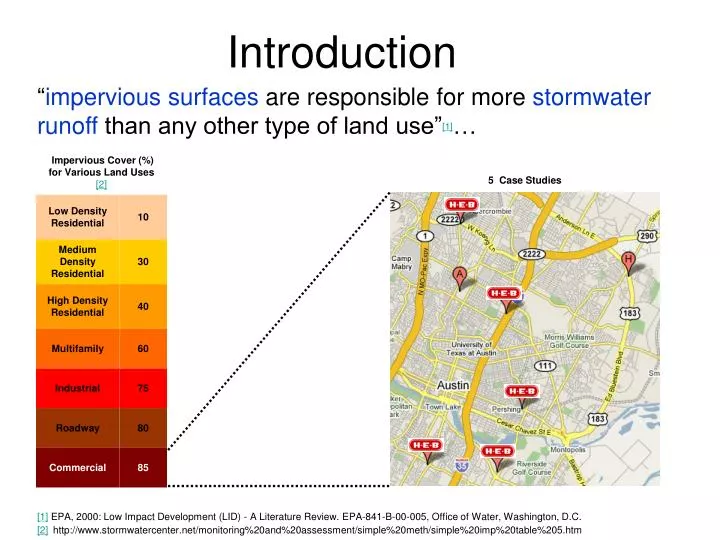
“ impervious surfaces are responsible for more stormwater runoff than any other type of land use” [1] …. Introduction. 5 Case Studies.

E N D
“impervious surfaces are responsible for more stormwater runoff than any other type of land use”[1]… Introduction 5 Case Studies [1] EPA, 2000: Low Impact Development (LID) - A Literature Review. EPA-841-B-00-005, Office of Water, Washington, D.C. [2]http://www.stormwatercenter.net/monitoring%20and%20assessment/simple%20meth/simple%20imp%20table%205.htm
Four Sites 1% 1% 1% 1% Stormwater Quantity StormwaterQuality Three paving materials Manning’s n Runoff Coefficient 0.30-0.70 Interlocking pavers 0.03 Porous asphalt 0.18- 0.29 Porous concrete
Objective: evaluate various surface materials in urban parking areas to reduce stormwater runoff and annual pollutant loads Definition: “Porous pavement is a permeable asphalt or concrete surface that allows stormwater to quickly infiltrate to an underlying stone reservoir” Pennsylvania Stormwater Management Manual
Peak Flow Q = CiA • Rational Method • widely used for smallurban drainage area • required limited data As Tt=Tc increases peak runoff decreases Peak Flow (cfs)
Length of Flow Path 434.73 ft Tc= Tt for only one segment S Congress 695.10 ft 695.10 ft E 7th Street 632.33 ft 632.33 ft 632.33 ft E. Riverside Dr 509.67 ft 509.67 ft Burnet Road Travel Time “Travel time ( Tt ) is the time it takes water to travel from one location to another in a watershed”. Time of Travel (hr) Depth of precipitation (in) Recurrence interval 2yr Ferguson, B. 2005. Porous Pavements. CRC Press http://www.dep.state.fl.us/water/nonpoint/docs/erosion/chapter3.pdf
Annual Pollutant Loads Simple Method L = 0.226 * R * C * A • “No significant relationship was found for total suspended sediment based on impervious cover or development condition” • TP and TN: impervious cover ranges: 0-1% and 5-100% Pollutant concentration: STORMWATER RUNOFF QUALITY AND QUANTITY FROM SMALL WATERSHEDS IN AUSTIN, TX, City Of Austin, Watershed Protection Department, Environmental Resources Management Division, Water Quality Report Series, COA-ERM/WQM 2006-1, November 1, 2006
Water Quality Volume Area 632,397.80 ft2 S Congress 93,5788.57 ft2 667,667.02 ft2 E 7th Street 1,706,624.16 ft2 658,754.68 ft2 E. Riverside Dr 902,001.86 ft2 621,467.95 ft2 Burnet Road 1,051,130.49 ft2 Average 10% reduction in WQvwith decrease impervious surfaces An average increase of21% of WQv New York State Stormwater Management Design Manual
Costs! / Incentives? • Regional Stormwater Management Participation Fees • “the number of impervious acres…based on the maximum allowable impervious cover” • BMP’s • Land on average a 33% increase note: Average price per ft2 from EPA, Dr. Barrett, City of Seattle Department of Planning and Development and City of New York ;base/storage bed not included in cost estimate. http://www.ci.austin.tx.us/watershed/rsmp_fee_com-mf.htm
Preliminary Conclusions • Maintaining flow path lengths • Regulation • Reduce stormrunoff and increase water quality • Disconnecting impervious surfaces • Porous surfaces • END
Simple Method L = 0.226 * R * C * A L= Annual load (lbs) P= Pollutant Concentration A= Area (acres) R= Annual Runoff (inches) R = P * Pj * Rv P= Annual Rainfall (in) Pj= Fraction of year rainfall events that produce runoff 0.9 Rv= Runoff Coefficient Rv=0.05+0.9Ia Ia= Fraction of impervious cover
WQv=Water Quality Volume (ft3) A= Total Area (ft2) P= 90% Rainfall event (inches) 1.4 in for Austin Rv=0.05+0.9Ia Ia= Fraction of impervious cover Ap= Porous Pavement Surface (ft2) n=Porosity of bed gravel (0.4) dt=Depth of gravel bed/reservoir (ft) WQv=Water Quality Volume (ft3) New York State Stormwater Management Design Manual


