Download
1 / 29
290 likes | 809 Views
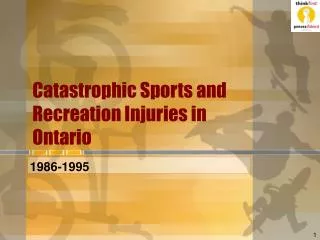
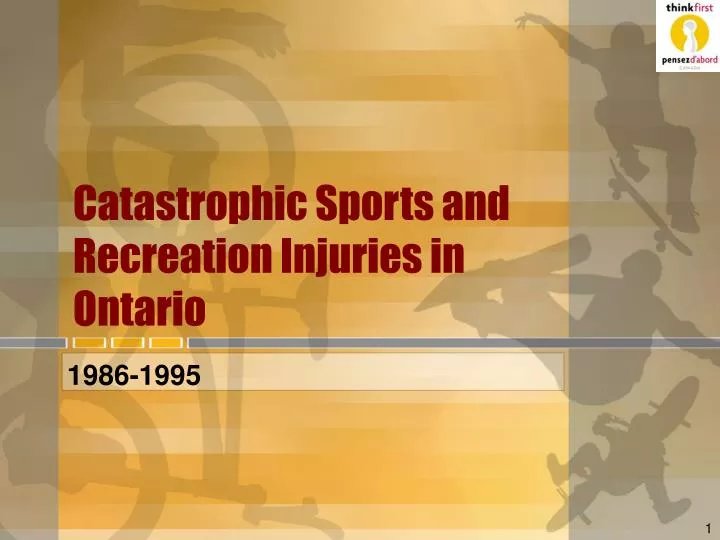
Catastrophic Sports and Recreation Injuries in Ontario 1986-1995 Objectives After this presentation, participants will: Understand the process of obtaining “comprehensive”* data on catastrophic injuries in sports Discuss the top 10 most injurious sports, from a neurotrauma perspective

E N D
Catastrophic Sports and Recreation Injuries in Ontario 1986-1995
Objectives • After this presentation, participants will: • Understand the process of obtaining “comprehensive”* data on catastrophic injuries in sports • Discuss the top 10 most injurious sports, from a neurotrauma perspective • Know the major risk factors associated with neurotrauma in sports • Be introduced to best practices in the prevention of neurotrauma in sports
Understanding Injury Through Epidemiology • What? • How? • Where? • How often? • To whom?
Method • Data was gathered through prospective surveys sent to selected physicians and surgeons, or data coordinators at 11-13 regional Trauma Centres; Coroner’s System; media reports • This study uses data from four study years: 1986, 1989, 1992, and 1995.
Number of Individuals Sustaining Fatal or Non-Fatal Catastrophic Injuries(1985-1989-1992-1995) The annual rate of catastrophic injuries was 2154/4, or 539 per year
What do we mean by catastrophic*? Death Lifelong disability *includes all brain and spinal injuries (2154 cases or 539 per year of study) 1. What ? Types of Injuries • Chest Injuries (snowmobiling, bicycling) • Eye Injuries (hockey, baseball, racquet sports) • Facial Injuries (snow-mobiles, hockey,bicycling) • Limb Injuries (uncommon) • Drowning (Fishing, swimming, boating) • Brain Injuries (bicycling, snowmobiling, ATVs) • Spinal Injuries (diving, snowmobiling, hockey) • Sudden Death (basketball, squash, badminton)
4. How Often?The frequency of the main types of injuries during the four study years Figure 2.6 The frequency of the main types of injuries during the four study years. Figure 2.6 The frequency of the main types of injuries during the four study years. Figure 2.6 The frequency of the main types of injuries during the four study years. Figure 2.6 The frequency of the main types of injuries during the four study years. Figure 2.6 The frequency of the main types of injuries during the four study years. Figure 2.6 The frequency of the main types of injuries during the four study years. Figure 2.6 The frequency of the main types of injuries during the four study years.
Head and Spine Injuries – Survivors and Fatalities 1985, 1989, 1992, and 1995
Head and Spine Injuries – Survivors and Fatalities 1985, 1989, 1992, and 1995
5. Who?Age by Decade and Gender of Individuals Sustaining Fatal or Non-Fatal Catastrophic Injuries 1986-1989-1992-1995
5. Who? 17% 83%
Best Practices… …in sports injury prevention • Prevention is the only cure! • Technological innovations, legislative interventions are most proven • Context is key – sports are relatively autonomous fields • Risk factors point to prevention approaches • What • Where • How often • To whom
Summary • Epidemiology answers many important questions • what?, how?, where?, how often?, to whom? • Effective interventions are possible • Missing info: Socio-cultural context of sports • What can be done? What should be done? How can/should things be done? • Interdisciplinarity is key- IP in sports involves changes in complex social and meaning systems