Download

1 / 5
50 likes | 202 Views
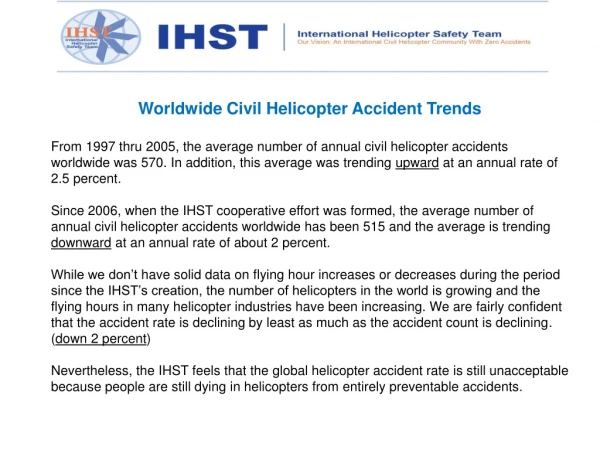
Worldwide Civil Helicopter Accident Trends From 1997 thru 2005, the average number of annual civil helicopter accidents worldwide was 570. In addition, this average was trending upward at an annual rate of 2.5 percent.

E N D
Worldwide Civil Helicopter Accident Trends From 1997 thru 2005, the average number of annual civil helicopter accidents worldwide was 570. In addition, this average was trending upward at an annual rate of 2.5 percent. Since 2006, when the IHST cooperative effort was formed, the average number of annual civil helicopter accidents worldwide has been 515 and the average is trending downward at an annual rate of about 2 percent. While we don’t have solid data on flying hour increases or decreases during the period since the IHST’s creation, the number of helicopters in the world is growing and the flying hours in many helicopter industries have been increasing. We are fairly confident that the accident rate is declining by least as much as the accident count is declining. (down 2 percent) Nevertheless, the IHST feels that the global helicopter accident rate is still unacceptable because people are still dying in helicopters from entirely preventable accidents.
Accident Chart The following chart displays worldwide civil helicopter accident totals for an 18-year period, with the blue line reflecting the total annual number of accidents. The red dashed line shows the expected total annual accidents if the pre-2006 trend had continued. The yellow dashed line shows the new expected accident totals using 2006 through 2012 data.
Average of 570 accidents per year from 1997 thru 2005 Average of 515 accidents per year from 2006 thru 2012
Worldwide Civil Helicopter Accidents Year# of AccidentsYear# of Accidents 1995 426 2006 491 1996 547 2007 564 1997 488 2008 537 1998 541 2009 540 1999 566 2010 477 2000 598 2011 554 2001 554 2012 439 2002 643 2013 ----- 2003 607 2004 567 2005 566
U.S. Civil Helicopter Accidents YearTotal AccidentsFatal Accidents 2007 171 24 2008 143 35 2009 152 20 2010 134 29 2011 129 19 2012 148 23 2013 147 31