Download
1 / 13
130 likes | 243 Views
Examples of Different Models for Scoring Components in HPSA and MUA Designation: Discussion Paper for the Negotiated Rule Making Committee Prepared by: National Center for Health Workforce Analysis, Bureau of Health Professions, HRSA 14 April 2011.

E N D
Examples of Different Models for Scoring Components in HPSA and MUA Designation: Discussion Paper for the Negotiated Rule Making Committee Prepared by: National Center for Health Workforce Analysis, Bureau of Health Professions, HRSA 14 April 2011
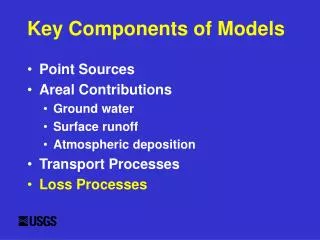
Grouping various indicators into categories or components. Method for scoring indicators within each component to calculate a component score; and Developing a method for combining component scores for determining designation as HPSA and/or MUA. Focus on II and III Note: Examples outlined may be applicable to models for MUP & Population HPSA designations although not discussed.
II. Scoring indicators in a component for component score • Indicators combined with equal weights or unequal weights? • How combined indicators with different scales? • One method to “standardize” scales: Convert values into • percentiles (ranking of areas on indicator values) • Group into percentile groups (e.g., centiles, deciles). If deciles used, 10 = “worst case” and 1 = “best case.” Percentile groups as % of areas (e.g., % all US counties) or % of US population covered? If deciles, 10% of counties or 10% of population?
Component score: • Indicators given equal weight: • an area’s score for component is sum of scores on each indicator • Indicators given different weights: • Weights total 1.00 • Each indicator score multiplied by weight • Weighted scores summed across indicators Assumption: Distributions of indicators reasonably spread out across universe of areas? • How handle indicator not reasonably dispersed across the universe of areas—rare event/in relatively few areas? (Bottom page 2 in paper)
Combining individual component scores for determining designation as HPSA and/or MUA: Examples are possible model scenarios: Model One: A generic “index” model : all components combined into single score, with equal weight as a starting premise. Model Two: A ‘sequential’ model requiring threshold on one component met first before scored for other components. First component an initial filter. Other components treated with equal weight. Model Three: A ‘sequential’ model requiring threshold based upon two components met first before scored for other components. Other components treated with equal weight.
Model One: A generic “index” model : all components combined into single score, with equal weight as a starting premise.1 (Pages 4 &5) Component 1: (e.g., Social Determinant Index (SDI)) Component 2: (e.g., Observed Health Status) Component 3: (e.g., Observed Access Indicators (e.g., ACS hosp., etc.)) Component 4: (e.g., Access Barriers (e.g., race, language, etc) Component 5: (e.g., Provider to population ratio (P2P)) 1Components listed for purposes of illustration only and may not be the components the Committee decides to use in its final model or models. The Committee has also discussed including ability to pay as its own component. Ability to pay could also be included under Access Barriers or Social Determinants of Health. No decision has been made on this.
Model One--continued Step 1: For each component, calculate the distribution of the statistic (i.e., the score on the component). Step 2: For each component, categorize the distribution of the statistic by a percentile grouping. Step 3: For each geographical area, score each component based upon the percentile group. If deciles used, the scores would range from 1 to 10 where 10 could be “worst case” and 1 “best case.” Step 4: Calculate the total score for each area by summing the scores in each component. Step 5: Set the threshold for designation based upon the distribution of the total score, e.g., the highest XX% of the total scores are designated as an area in need. • This cutoff value would be the threshold value in the rule for designation of an area in need.
Model Two: A ‘sequential’ model requiring threshold on one component met first before scored for other components. • In this example, we focus on designation of a HPSA for illustration purposes. • Step 1. Threshold for filter component: • Component 5: Provider/Population Ratio (P2P) • This threshold would be the first threshold in the rule Step 2: Continue evaluation of HPSA status on Components 1 through 4 for only areas satisfying Step 1. • Component 1: Social Determinant Index (SDI) • Component 2: Observed Health Status • Component 3: Observed Access Indicators • Component 4: Access Barriers Scoring of the components 1, 2, 3, and 4 would be similar to the scoring of these components in Model One.
Model Two--continued: Step 3: Sum scores on Components 1 through 4 for total score • Step 4: Set the threshold for final HPSA designation based upon the distribution of the total score of Components 1 through 4: • XX% of the areas considered after Step 1 with the highest total score on Components 1 through 4. • This cutoff value would be the threshold value in the rule for HPSA designation among areas meeting the threshold of Step 1.
Model Three: A ‘sequential’ model requiring threshold based upon two components be met first. For purposes of this illustration, we focus on an MUA designation. Step 1. Threshold for filter based upon combined score of two components (Components 1 and 2): Social Determinant Index (SDI) Observed Health Status Score on Observed Health Status (e.g., ranking by deciles) Score on SDI (e.g., ranking by deciles) First Total Score (sum of SDI and Observed Health Status scores) • Set first threshold in MUA designationprocess • This would be the first threshold in the rule to meet for further evaluation.
Step 2: Continue evaluation of MUA status on Components 3 through 5 for only areas satisfying Step 1. Observed Access AccessBarriers Provider/Pop. (P2P) Indicators Score on Access Barriers (e.g., ranking on deciles) Score on Observed Access (e.g., ranking on deciles) Score on P2P (e.g., ranking on deciles) Second Total Score (sum of Observed Access, Access Barriers and P2P) Step 3: Step 4: Set threshold for final MUA designation based upon the distribution of the second total score
Questions? Discussion/Implications?
Examples of Different Models for Scoring Components in HPSA and MUA Designation: Discussion Paper for the Negotiated Rule Making Committee Prepared by: National Center for Health Workforce Analysis, Bureau of Health Professions, HRSA 14 April 2011