Download
1 / 52
520 likes | 665 Views
Lecture Notes ECON 437/837: ECONOMIC COST-BENEFIT ANALYSIS Lecture Eleven. COST EFFECTIVENESS ANALYSIS. Cost Effectiveness Analysis.

E N D
Lecture Notes ECON 437/837: ECONOMIC COST-BENEFIT ANALYSIS Lecture Eleven
Cost Effectiveness Analysis • Cost effectiveness analysis (CEA) looks at a single quantified effectiveness measure of the cost per unit. For example, the cost in dollars of a life saved, the least cost way of supplying electricity or water to a community. • Used heavily in social programs and projects where identification and quantification of benefits in money terms is not straightforward but, at the same time, the desirability of the activity is not in question. • For example, in the case of health care: • What is the best way to prevent heart attacks? • What drugs are most cost effective in the treatment of illness? • What is the least cost way of providing nutrition to poor children? • Which of the programs is most cost effective for AIDS prevention?
Cost Effectiveness Analysis(cont’d) • Examples of application to other areas: • Choosing from two school systems that give same education benefits • Centralized schools that require bus transportation and more expensive smaller schools to which students can walk. • Two types of court systems • More court rooms at the headquarters or mobile courts. • Alternative ways of supplying potable water to communities. • Alternative technologies to generate electricity • Thermal vs hydro; single vs combined cycle plant • The objective is to compare costs per unit of outcome of alternative approaches or technologies that will provide the same service for purposes of capital budgeting.
Cost Effectiveness Analysis (cont’d) • The focus of a cost-effectiveness analysis is on evaluating the costs of the alternatives. • The analysis involves the measurement of benefits in some kind of quantifiable manner (e.g., lives saved, schooling years increased, additional water consumed) and then compare the effectiveness of alternative options to deliver the project or program: • Computing the ratio of costs (Ci) to its benefit (Ei), for example, dollars per school seat. • Alternatively, measuring the effectiveness (Ei) in terms of its cost (Ci).
Costs Assessment • While computing cost-effectiveness ratio for a particular project, attention should be paid to the treatment of costs, which include not only financial but also social and economic costs. • In the education sector, the enhancement of primary schooling is sometimes viewed in terms of the additional number of schools blocks and improvement of their physical condition. But any programs of developing school systems must also take into account the cost of additional teaching personnel, teaching materials and regular maintenance costs. • For health projects, analysts should identify capital costs (expenditures for hospital/clinic, equipment, and training), recurrent expenditures (costs for administrators, doctors, nurses, lab technicians, unskilled support, and other staff), and indirect costs (patients’ time and travel).
Discounting • Although cost effectiveness analysis does not place a monetary value on the benefits, the project’s benefits (effectiveness) has to be discounted to the same year as the discounted costs. • Both the costs and units of effectiveness should be discounted by the same rate. • The cost-effectiveness ratios are computed for each of the alternatives and then the analyst can rank the alternatives and take a decision.
Discounting in Health Care Evaluation • Currentlya 3% discount rate used in both costs and benefits by convention is far too low. • As most health interventions need to be continued through time (e.g. drugs), the discount rate is not too critical as most costs and benefits occur in the same period. • Discounting, however, is very important when capital expenditures are involved such as construction of clinics, hospital, or equipment of CAT scan, MRI machines. • Failure to discount future health benefits and costs properly can lead to paradoxical results.
CEA Can Be Used in Two Forms: Method 1: Constant Effects • Uses least-cost analysis to determine the lowest cost alternative for meeting the same level of benefits, including intangible benefits. • Selection criteria is “choose the alternative that has the lowest present value of costs.” • The outcome may be a function of the rate of discount and may switch with change in discount rate. • Example: • Choosing from two types of water pipes of different diameters that yield the same quantity and quality of water per day (smaller pipe has lower investment cost but higher operating or pumping costs), • Selecting from two alternatives for generating the same amount of electricity (thermal and hydro generation units, the former with a lower investment and higher operating cost compared to the latter).
(All figures in '000) Alternative A: Years 0 1 2 3 4 5 Installation cost 3000 Operating cost 700 700 700 700 700 Total cost 3000 700 700 700 700 700 5,723 $ PV of Total cost (at 6%) $5,949 PV of Total cost (at 9%) Alternative B: (All figures in '000) Years 0 1 2 3 4 5 Installation cost 4200 Operating cost 400 400 400 400 400 Total cost 4200 400 400 400 400 400 PV of Total cost (at 6%) $5,885 PV of Total cost (at 9%) $ 5,756 The results switch with change in discount rate. Case 1Least Cost Method Drinking Water: Alternative Delivery Systems
Method 2: Cost-Effectiveness Ratio • Calculates the cost per unit of benefit. Both benefits and costs vary across alternatives. • Example: Benefits are simply measured as the number of Premature Deaths Prevented. • Two different health programs: DPT-BCG vaccination campaign for children or AIDS treatment program for infected patients. • The cost per child vaccination and per patient will be computed in this case. Here the purpose is to see which program yields more value per dollar of expenditure.
(All figures in ' 000 of US$) Year 2000 2001 2002 2003 2004 2005 Premature Deaths Prevented - 8,000 12,000 18,000 25,000 30,000 Capital Costs Facilities 2,500 Equipments 8,500 Vehicles 5,000 Training 2,000 Technical Assistance 6,000 Recurrent Costs Personnel 10,000 16,000 25,000 36,000 42,500 Supplies 15,000 24,000 37,500 55,000 64,000 Training 500 800 1,250 1,800 2,100 Maintenance 2,000 3,200 4,500 7,200 8,000 Others 3,300 5,500 8,200 12,000 14,500 Total Costs 24,000 30,800 49,500 76,450 112,000 131,100 Present value of Total Benefits 6.0% 75,560 9.0% 68,547 Present value of Total Benefits Present Value of Total Costs 6.0% 347,980 9.0% 317,503 Present Value of Total Costs 4.61 4.63 Cost per unit of Premature Deaths Prevented Case 2Cost of Health Project: Immunization against DPT (diphtheria, pertussis and tetanus)- Bacillus of Calmette and Guérin (BCG- against tuberculosis)
(All figures in ' 000 of US$) Year 2000 2001 2002 2003 2004 2005 Deaths Prevented - 500 750 1,000 1,400 1,750 Capital Costs Facilities 200 Equipments 1,000 Vechicles 300 Training 500 Technical Assistance 1,500 Recurrent Costs Personnel 2,000 2,500 4,000 5,000 6,000 Supplies 40,000 65,000 90,000 120,000 150,000 Training 100 100 100 100 100 Maintanance 250 300 450 600 800 Others 300 500 800 1,250 1,500 Total Costs 3,500 42,650 68,400 95,350 126,950 158,400 Present value of Total Benefits 6.0% 4,395 9.0% 3,991 Present value of Total Benefits Present Value of Total Costs 6.0% 403,591 9.0% 366,711 Present Value of Total Costs 91.82 91.88 Cost per unit of Deaths Prevented Case 3Cost of Health Project: AIDS Program
Incremental (or Marginal) Cost-Effectiveness Ratio • The decision makers need to compute incremental (or marginal) cost-effectiveness ratios. • This need arises when a new alternative is compared with the existing situation. • The numerator now contains the difference between the cost of the new and old alternatives, and the denominator is also the difference between the effectiveness of the new and old alternatives: • This ratio can be interpreted as the incremental cost per unit of effectiveness. When there are several alternatives available, the marginal cost-effectiveness ratio can be used to rank the new measures versus the existing one.
Case 4Marginal Cost-Effectiveness Ratios in Prevention of Traffic Fatalities
Limitations of CEA 1. Does not measure willingness to Pay • CEAs are a poor measure of consumers’ willingness to pay as the output or benefit is not priced in the market nor is the output considered homogeneously. • What is the willingness to pay for the additional “drug addicts treated”? • The number of addicts treated may not be the best approximation of the value of the final outcome (i.e., consequential crime reduction may also be important for the taxpayers). • The link between the intermediate measure of effectiveness and final output, such as reduction in crime, is not explicitly stated. • Faced with this kind of situation, the analyst must make sure that this link is properly established. Even with this link, it is hard to know the value of the final outcome if no market value is placed.
Limitations of CEA (cont’d)2. Excludes some external benefits • The concept of CEA excludes most externalities on the benefits side. • On the benefit side, the CEA looks only at a single benefit and all other benefits are essentially ignored. • An improvement in education will not only increase life-time earnings of the students but also contribute to a reduction in the rates of unemployment and crime. • In healthcare, there are external benefits due to such treatments as the vaccination of children, i.e. other people do not catch the infection diseases. • The above issue will not occur for a complete CBA. The analyst doing the CEA should be careful not to exclude important benefits arising from a particular project.
Limitations of CEA (cont’d) 3. Excludes some external costs • While computing the cost-effectiveness ratio for a particular project, attention is paid to the treatment of costs, which should include not only financial but also social costs. • In the education sector, the enhancement of primary schooling is sometimes viewed in terms of the additional number of school blocks and improvement of their physical conditions. Many other costs must be included to get the desired outcome. • Different types of projects often have some of the costs in non-monetary terms, such as waiting time, coping costs, enforcement costs, regulatory costs, compliance costs, etc. • The economic CEA carried out for such projects must account for all costs based on the economic instead of financial prices of goods and services.
Limitations of CEA (cont’d) 4. Does not account for scale of project • Scale differences may distort the choice of an “optimal” decision. • A project with smaller size but higher efficiency level may get accepted, while another project may provide more quantity of output at a reasonable cost. • A strict CEA fails to overcome this problem. • A complete CBA does not have this problem because the net present value already accounts for the differences in size among alternative projects.
Scale Problem in CEA • Let’s say there are two mutually exclusive options in the choice of medical diagnostic equipment for a clinic. • The first type of machine (A) costs R 50,000 and it can diagnose 200 patients a month. • The second option involves more expensive equipment (B), which will cost R 300,000 but could serve up to 1,150 people a month. • The CEA results in the selection of the least costly alternative, option A, which costs R 250 per diagnosis. • Option B allows to process almost a six-fold higher number of medical tests a month, at cost of R 261 per patient. • Unless there is a severe budget constraint for implementation of alternative B, this alternative could be justified even if its average costs are higher than costs of alternative A. This is because the total benefits that alternative B generates are very much larger than the benefits of alternative A.
Cost-Utility Analysis • The estimation of benefit in CEA is limited to a single measure of effectiveness such as reduction of mortality. This simplification ignores benefits stemming from reduced morbidity and, hence, a cost utility analysis (CUA) is employed. • In principle, CUA could be used with multiple outcomes but as the number of dimensions grows, the complexity of analysis also increases. • Practically, CUA has been traditionally utilized in healthcare, measuring improvement in health as measured by both quantity (years of life) and quality of healthcare improvement (health status). • Each type of benefit (Bj) would be assigned its relative importance, or weight (wj), in the utility:
Types of Economic Evaluation in Health Sector • Economic evaluation: compare the resources consumed with the health consequence. • The benefit of an intervention is better described as extending the life span of individuals, rather than preventing deaths alone. • Disability-Adjusted Life Years (DALY) - Overall measure of disease burden by combining years of life lost and years lived with disability • Quality-Adjusted Life Years (QALY) - Measure of quality of life
Disability Adjusted Life Years (DALY) • The DALY index calculates the productive years lost from the ideal lifespan due to morbidity or premature mortality – a measure of the combined quantity and quality of life. • Reduction of productivity due to morbidity is a function of the years lived with the disability, and an assigned weighting. • It allows both morbidity and mortality to be considered in a single measure. Nevertheless, it is to some extent subjective and controversial.
Quality Adjusted Life Year (QALY) • QALY is a measure of combining the quantity and quality of life. It takes one year of perfect health-life expectancy to be worth 1, but regards one year of less than perfect life expectancy as less than 1. • An intervention results in a patient living for four years rather than dying within one year. Hence, the treatments add 3 years to the person’s life. However, if the quality of life falls from 1 to 0.5, the treatment generates 1.5 QALY. • The weights/index are generally obtained through survey or medical experts in the field. • QALYsprovide an indication of the benefits gained from a variety of medical procedures in terms of quality, life, and survival for the patient.
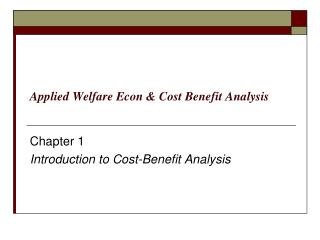
Economic Evaluation of Education Projects • Educational projects may have many types of components, with benefits measurable in both monetary and non-monetary terms. • Investment in education generates various in-school and out-of-school benefits. • In-school benefits include gains in the efficiency of the education system. • Out-of-school benefits include improvement of the income-earning skills of the students and externalities (benefits) that accrue to society at large beyond the project beneficiaries.
Evaluating Investments with In-School Benefits • In-school benefits include gains in the efficiency of the education system (e.g., enhance learning, reduce student’s repeat, reduce crime). • As in any other enterprise, the production of education services involves decisions how it combines inputs to produce the desired objectives. • Alternative ways to enhance the educational system: • Invest in writing and textbook; • Invest in educational software; • Invest in hardware facilities/furniture; • Upgrade teachers.
Evaluating Investments with Out-of-School Benefits • Out-of school benefits arise after the project’s beneficiaries finish a course of study or leave a training program. • The most obvious of such benefits is the gain in the beneficiaries’ work productivity, as reflected in differences in pay (or in farm output). • The difference in outputs between the two groups of farmers, valued in market prices, can be used to estimate the economic benefits of investing in primary education. • In evaluating a project from society’s point of view, the benefits include gross-of-tax earnings and fringe benefits in the wage package such as retirement benefits. • Most of the social benefits are difficult to quantify including crime reduction, social cohesion, income distribution, possibly fertility reduction.
The calculation typically involves two steps: 1) estimating the relevant age earnings profiles to obtain the increment in earnings at each age;2) discounting the stream of incremental earnings using an appropriate discount rate. Figure 1. Age-Earnings Profiles of High School and University Graduates in Venezuela, 1989 300,000 250,000 University Graduates 200,000 150,000 100,000 High School Graduates 50,000 12 16 20 24 28 32 36 40 44 48 52 56 60 Source: Pedro Belli (2001) Age
If the returns to university education interest us, the profiles would refer to earnings for university and high school graduates. Age earnings profile of university graduates Benefits Earning/Cost Age earnings profile of school graduates secondary Forgone Earnings 18 65 22 Age Direct Costs 47 0 4 Time (Years) Source: Pedro Belli (2001)
The standard formula in cost-benefit analysis can be modified to the specific problem here: , • refer to the earnings of secondary and university graduates - refers to annual unit cost of university education - refers to the discount rate - refers to the time periods
Investment in Education • In many developing countries the budget that is allocated to educational sector is a significant proportion of total public sector expenditure. • Allocating the budget efficiently within the Department of Education is important for both public sector efficiency and the effectiveness of the delivery of education services.
CEA in Education • Efficiency in education is affected by many different factors such as: • Number of available classrooms • Number of learners in each class • Level of knowledge and expertise of teachers • Availability of text books and other facilities • A serious shortage of classrooms may prevent students from entering school. It may result in overcrowding, thereby decreasing the efficiency in learning of students and discouraging them from attending school. • A CEA is to find the most efficient use of the given budget allocation using the limited information available such as the number of classrooms available in each school district relative to the number of students in that district.
An Example:Province of Limpopo in South Africa • In some provinces of South Africa as well as elsewhere in Africa, the most urgent problem with the primary and secondary school system is a shortage of classrooms. • For example, the education system in Limpopo of South Africa has been suffered from shortage of classroom space. Since 1997 great efforts have been made to deal with problem. Between 1995-2002, 7,800 classrooms were built. It was expected to take about 10-15 years to overcome the backlog of schools that are needed. • The issue is how to prioritize the areas where the school classrooms should be built until the budget is exhausted. • It is difficult to place monetary value on the annual benefits of an investment in new classrooms. • Benefits are related to reduction in students/classrooms ratio and the number of students affected by the reduction.
Cost-Utility Analysis • A cost-utility analysis (CUA) is maximizing the overall effectiveness of public expenditure on school infrastructure by taking into account important factors. • Information on key factors available for each school area: • Number of available classrooms • Number of learners in the school area and a projection of future growth of number of learners in the area • Type of school (Primary or Secondary) • Location of school (Urban or Rural) • Support facilities of the existing school • A CUA approach is to measure a “priority index”, including a weighted average of all the key factors affecting the project selection.
Calculation of Priority Index • A “priority index” (PI) can be constructed to include infrastructure adequacy and other important factors such as facilities available at school.
Infrastructure Adequacy • There are two aspects of infrastructure adequacy: class-block backlog and the learner-to-classroom ratio. • (A) Class-block Backlog. The class-room backlog is estimated as a number of additional buildings, measured by a standard 4-class block, required at a particular school in order to maintain the maximum acceptable class size. Weight in PI Index = 0.70. • (B) Learner-to-Classroom / Target Class Size Ratio. The overcrowding of classes is measured by the excess of actual class attendance to the maximum target class size, i.e. by the learner-to-classroom / target class size ratio. Weight in PI Index = 0.30.
Example • A mixed sample of both primary and secondary (S3, S4, and S6) schools in urban and rural areas. All 8 schools have infrastructure backlogs. • Different sizes of schools, and different number of classrooms are currently available. • The availability of basic facilities varies from location to location. • Question: How to rank these schools in terms of their priority for additional infrastructure?
Efficiency Maximization Rule • RULE: Because the priority index reflects a number of objectives, the overall effectiveness of budget spending is maximized when the funds are forwarded to schools with the highest ranking. • Since each additional building will alter the current priority index and ranking of schools, the ranking is recalculated after each new addition of class-rooms or changes in support facilities and the type of school. • It is a multi-stage selection process until the budget is exhausted.
Budget Allocation Results • The objective is to ensure that the benefits are maximized from the allocation of capital budget for the construction of new class-blocks. • Notes: * Ranked first before allocation. ** Ranked second before allocation. *** Ranked third before allocation.
CEA: Power ProjectsLevelized Economic Cost of Energy with Alternative Technologies Single Combined Cycle PlantCycle Plant PV of Economic Cost (M Rupees): Investment Costs 146.83 205.57 O&M Costs 68.95 68.95 Fuel Paid by the Utility 388.72 207.32 Total 604.51 481.84 PV of Energy Generated (MWhs) 3,297,471 3,297,471 Levelized Cost of Energy: Cost Expressed in Rupees/kWh 0.183 0.146
CEA for Water Projects: Present Value of Water Shortagesunder Alternative Development Strategiesand Project Schedule (million M3, 2002)