Download
1 / 42
440 likes | 591 Views
Quasigeostrophic Diagnosis of an Explosively Developing Cyclone Along the Northern California Coast. Geoff Roest MS Thesis Defense San Francisco State University April 22, 2014. Contents. Introduction Notable Characteristics and Impacts of Storm Synoptic Analysis of Storm

E N D
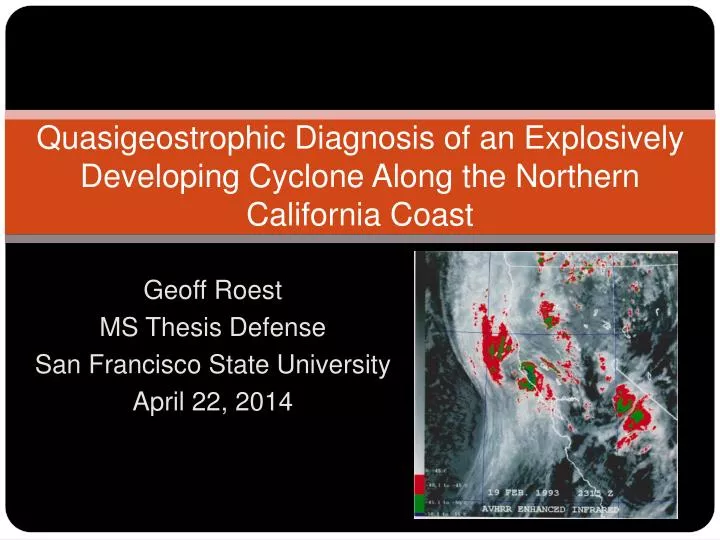
Quasigeostrophic Diagnosis of an Explosively Developing Cyclone Along the Northern California Coast Geoff Roest MS Thesis Defense San Francisco State University April 22, 2014
Contents • Introduction • Notable Characteristics and Impacts of Storm • Synoptic Analysis of Storm • Explosive Cyclogenesis and Polar Lows • Methodology • Details of Quasigeostrophic Diagnosis • Discussion of Results • Summary of Findings
Introduction • 19 February 1993 – disturbance off California coast rapidly developed into strong cyclone • Several inches of rain, gusts exceeding 90 mph, one tornado • Extensive property damage, 1 death Introduction Storm Overview Analysis Background Methodology QG Diagnosis Results Summary
Introduction • Initial low developed in eastern Pacific, moved into northern California/Oregon • New area of low pressure developed over coastal waters along occluded boundary Introduction Storm Overview Analysis Background Methodology QG Diagnosis Results Summary
Introduction • New are of low pressure rapidly deepened • Buoys indicated pressure fall of 13 mb in 14 hours (NOAA) • Eye, warm core • Resembled hurricane… • “Polar lows” – type of high-latitude cyclone • Also mid-latitudes • Cloud-free eyes • Warm cores Introduction Storm Overview Analysis Background Methodology QG Diagnosis Results Summary
Introduction • Objective – to explore development main 19 February 1993 cyclone, secondary cyclone • Was processes contributed to rapid cyclogenesis? • Was the storm a mid-latitude version of a ‘polar low’? Introduction Storm Overview Analysis Background Methodology QG Diagnosis Results Summary
Introduction Noteworthy Characteristics • Evidence of warm core (TIROS Operational Vertical Sounder data) IntroductionStorm Overview Analysis Background Methodology QG Diagnosis Results Summary
Noteworthy Characteristics • Anomalously warm sea surface temperatures (SSTs) • Large SST-atmosphere temperature difference IntroductionStorm Overview Analysis Background Methodology QG Diagnosis Results Summary
Impacts in California • Strong winds reported along entirety of California Coast • Wind gusts of 90-95 mph in Mendocino County • Rainfall – up to 4” • 3 – 6 feet of snow in Sierra • I80 closed • Frequent lightning in San Luis Obispo, Santa Barbara • Observer reported 135 individual strikes • Tornado, funnel clouds in Tulare County IntroductionStorm Overview Analysis Background Methodology QG Diagnosis Results Summary
Impacts in California • Reports of damage: • Roads flooded, washed away • Roofs blown of houses • Redwood trees with 5 ft. diameter blown down • One death • Tehama County, man was killed in vehicle by falling tree IntroductionStorm Overview Analysis Background Methodology QG Diagnosis Results Summary
Synoptic Analysis • Extratropical cyclone formed north of Hawaii, drifted east-southeastward for 36 hours • Deepened prior to landfall along West Coast • NCEP Reanalyses missed secondary cyclone development
00 UTC 20 February 1993 L 992 Where is secondary low? Introduction Storm OverviewAnalysis Background Methodology QG Diagnosis Results Summary
00 UTC 20 February 1993 L 992 29.14 in. Hg ≈ 986.8 mb Where is secondary low? Introduction Storm OverviewAnalysis Background Methodology QG Diagnosis Results Summary
Recap of Storm • 19 February 1993 storm experienced period of rapid pressure falls • Had characteristics reminiscent of a ‘polar low’ • Need to develop understanding of rapid cyclogenesis and polar low development Introduction Storm Overview AnalysisBackground Methodology QG Diagnosis Results Summary
Rapid Cyclogenesis • Sanders and Gyakum (1980) • ‘Explosive’ cyclogenesis • 1 mb per hour for 24 hours • ‘Bomb’ • Occur during cold season over ocean • Maxima in Pacific Ocean near Japan and south of Aleutian Islands • Infrequent in eastern Pacific near California Introduction Storm Overview AnalysisBackground Methodology QG Diagnosis Results Summary
Explosive cyclogenesis • Sanders and Gyakum (1980) calculated deepening rates • Fell short of observed deepening rates • Other processes influence cyclone development • Reed and Albright (1986) performed case study of bomb in eastern Pacific • Cyclonic vorticity advection • strong advection of warm, moist air • Diabatic heating • Low static stability due to latent, sensible heating Introduction Storm Overview AnalysisBackground Methodology QG Diagnosis Results Summary
Polar Lows • Small extratropical cyclones • Rapidly developing • Develop over warm sea surfaces during the winter • Warm core, eye Introduction Storm Overview AnalysisBackground Methodology QG Diagnosis Results Summary
Polar Lows • Sardie and Warner (1985) • Develop from residual circulations in polar air masses behind deep, occluded extratropical cyclones • Emanuel and Rotunno(1989) • Air-sea latent and sensible heating Introduction Storm Overview AnalysisBackground Methodology QG Diagnosis Results Summary
Polar Lows • Rasmussen and Turner (2003) developed polar low classification – seven types • Preliminary observations show similarities between ‘cold low’ polar lows and 19 February 1993 storm Classification of polar lows from, adapted from table in Rasmussen and Turner (2003, p. 159). Introduction Storm Overview AnalysisBackground Methodology QG Diagnosis Results Summary
Polar Lows • ‘Cold low’ polar low climatology: • Gulf of Alaska and Bering Sea (Businger1987) • Develops within cold core, occluded lows • No strong vorticity advection aloft • Weak low-level baroclinicity • Have also been identified at mid-latitudes over the Mediterranean Sea (Rasmussen and Zick 1987, Rasmussen and Turner 2003, p. 215) • Strong convection observed during polar low development Introduction Storm Overview AnalysisBackground Methodology QG Diagnosis Results Summary
Brief Review of Quasigeostrophic Theory • Simplified conceptual model of atmospheric flow • Applied to set of fundamental equations to produce QG equations, can be used to explain cyclogenesis • Forcing for vertical motion can be assessed as the sum of: • Forcing from vorticity advection • Temperature Advection Introduction Storm Overview AnalysisBackground Methodology QG Diagnosis Results Summary
Qualitative Assessment • Use conventional meteorological charts Introduction Storm Overview Analysis BackgroundMethodology QG Diagnosis Results Summary
Quantitative Assessment • Sutcliffe Petterssen Development Equation in natural coordinates (Palmen and Newton 1969, p. 316-326) • Simple, practical equation Introduction Storm Overview Analysis BackgroundMethodology QG Diagnosis Results Summary
Quantitative Assessment • Sutcliffe Petterssen Development Equation in Cartesian coordinates with expanded thermal terms (Carlson, 1998, pp. 185) Introduction Storm Overview Analysis BackgroundMethodology QG Diagnosis Results Summary
Quantitative Assessment • Data used comes from North American Regional Reanalysis (NARR) • Gridded data files • Two ‘hand’ calculations performed using synoptic scale gradient (200 km) Introduction Storm Overview Analysis BackgroundMethodology QG Diagnosis Results Summary
Explosive cyclogenesis, polar low characteristics • Assessed using: • Meteorological data • Qualitative observations • Quantitative results • Comparisons to literature Introduction Storm Overview Analysis BackgroundMethodology QG Diagnosis Results Summary
Results – Qualitative Assessment Introduction Storm Overview Analysis Background MethodologyQG Diagnosis Results Summary
Results – Quantitative Assessment • SPDE without expanded thermal terms • Only hand calculations performed for this analysis Introduction Storm Overview Analysis Background MethodologyQG Diagnosis Results Summary
Results – Quantitative Assessment • SPDE with expanded thermal terms • ‘Hand’ calculation results: Introduction Storm Overview Analysis Background MethodologyQG Diagnosis Results Summary
Discussion of Results • Qualitative assessment • Strong forcing from thickness changes (i.e. warming of the column) • Weak forcing from cyclonic vorticity advection • Quantitative assessment • SPDE without expanded thickness tendency term – same results Introduction Storm Overview Analysis Background Methodology QG DiagnosisResults Summary
Discussion of Results • Quantitative assessment • SPDE with expanded thickness tendency term • Unexpected results… • Temperature advection term made weak negative contribution • Results are plausible, although qualitative diagnosis shows warm air advection ahead of storm Introduction Storm Overview Analysis Background Methodology QG DiagnosisResults Summary
Discussion of Results • Vertical motion – large positive contribution • Sign of contribution – reasonable • Magnitude of contribution – unexpected • Possible error in static stability parameter, led to greatly exaggerated result Introduction Storm Overview Analysis Background Methodology QG DiagnosisResults Summary
Vertical Motion Term • Made large positive contribution • Evidence of upward vertical motion: • QG Forcing • Cloud development • Evidence of low stability: • Sounding for KVBG shows surface based CAPE of 1783 J/kg Introduction Storm Overview Analysis Background Methodology QG DiagnosisResults Summary
Discussion of Results • Diabatic heating term • Large magnitude was reasonable • Sign (negative) was opposite of expected result • Reason for error • Term calculated as residual: • Error in last term lead to error in diabatic heating term Introduction Storm Overview Analysis Background Methodology QG DiagnosisResults Summary
Diabatic Heating Term • Strong positive contribution to surface cyclogenesis • Evidence for sensible heating: • Air-sea temperature difference • Evidence for latent heating: • Strong convection Introduction Storm Overview Analysis Background Methodology QG DiagnosisResults Summary
Discussion of Results • Main cyclone dominated by thickness (temperature) changes • Warm air advection ahead of storm • Adiabatic, diabatic processes • Secondary cyclone • Upward vertical motion in environment with low static stability • Diabatic heating of lower troposphere • Polar low? Introduction Storm Overview Analysis Background Methodology QG DiagnosisResults Summary
Summary • Extratropical cyclone • Upward vertical motion in unstable environment • Strong diabatic heating of lower troposphere • Polar low developed along old occlusion • Driven by low stability over warm sea surface • Strong convection released latent heat • Widespread damage, 1 death • Strong winds, heavy rain, thunderstorms, tornado Introduction Storm Overview Analysis Background Methodology QG Diagnosis ResultsSummary
Summary • First documented polar low in coastal waters of western CONUS • First documented polar low to make landfall in California • Future research • Identification of other polar lows in California, western CONUS • Reassessment of current polar low climatology • Detailed comparison to other mid-latitude polar lows (Mediterranean Sea) Introduction Storm Overview Analysis Background Methodology QG Diagnosis ResultsSummary
References • Anderson, R. K., J.P. Ashman, F. Bittner, G.R. Farr, W. Ferguson, V.J. Oliver and A. H. Smith, 1969: Application of meteorological satellite data in analysis and forecasting. ESSA Tech. Rep. NESC51, Government Printing Office, Washington D.C. [NTIS AD-697033.] • Bluestein, H, 1992: Synoptic-Dynamic Meteorology in Midlatitudes. Vol. 1. Oxford University Press, 431 pp. • Carlson, T. N., 1998: Mid-Latitude Weather Systems. American Meteorological Society, 507pp. • Charney, J. and A. Eliassen, 1964: On the growth of the hurricane depression. J. Atmos. Sci., 21, 68-75. • Conway, E. D., 1997: An Introduction to Satellite Image Interpretation. The John Hopkins University Press, 242 pp. • Emanuel, Kerry, A., 1986: A two stage air sea interaction theory for polar lows. Proc., The Third International Conference on Polar Lows, Norway. • Emanuel, Kerry A. and Richard Rotunno, 1989: Polar lows as arctic hurricanes. Tellus, 41A, 1-17. • Los Angeles Times, 1993a: O.C. Freeways Awash in Storm: Weather: Latest deluge causes far fewer problems elsewhere, but it's small solace for snarling commuters. [Available online at http://articles.latimes.com/1993-02-19/news/mn-292_1_orange-county] • Los Angeles Times, 1993b: Residents Outmatched by Relentless Flooding: Weather: Backhoes and tractors prove unable to protect homes, as rising rivers close Sierra Highway, wash out driveways and isolate homes. [Available online at http://articles.latimes.com/1993-02-20/local/me-153_1_sierra-highway] • Markowski, P., and Y. Richardson, 2010: Mesoscale Meteorology in Midlatitudes. Wiley, 407 pp. • Lynott, Robert E., Owen P. Cramer, 1966: Detailed Analysis of The 1962 Columbus Day Windstorm in Oregon And Washington. Mon. Wea. Rev., 94, 105–117. • Monteverdi, John P., 1976: The Single Air Mass Disturbance and Precipitation Characteristics at San Francisco. Mon. Wea. Rev., 104, 1289–1296. • Monteverdi, 2008: The Sutcliffe-Petterssen Development Equation: Quasigeostrophic Development. San Francisco State University, 5 pp. • Monteverdi, J. P., E. Jan Null, Kathy L. Pagan, and Ernest Daghir, Explosively developing cyclone with “eye”: Extratropical “hurricane” along the West Coast? • National Weather Service, 1993a: Northern and Central California Weather Summary. National Weather Service San Francisco, CA.
References • National Weather Service, 1993b: Storm Report for 2/19/93. National Weather Service Eureka, CA. • NCDC, 1993: Storm Data and Unusual Weather Phenomena with Late Reports and Corrections, Vol. 35 No. 2. ISSN 0039-1972,74 pp. • NCDC, cited 2014: Surface Data, Hourly Global. [Available online at http://hurricane.ncdc.noaa.gov/pls/plclimprod/cdomain.abbrev2id] • NOAA Coastal Watch Program, 1993: Coastwatch. El Niño Watch, Advisory no. 93-2. 1 pp. • NOAA/ESRL PSD, cited 2013: NCEP North American Regional Reanalysis. [Available online at http://www.esrl.noaa.gov/psd/data/gridded/data.narr.html] • NOAA/ESRL PSD, cited 2014: NCEP/DOE AMIP-II Reanalysis (Reanalysis-2). [Available online at http://nomad3.ncep.noaa.gov/ncep_data/] • NOAA/NESDIS, cited 2014: ISCCP Global ISCCP B1 Browse System (GIBBS). [Available online at http://www.ncdc.noaa.gov/gibbs/] • Palmen, E., and C. W. Newton, 1969: Atmospheric circulation systems: their structure and physical interpretation. Vol. 13. International Geophysics Series, Academic Press, 624 pp. • Rasmussen, E. A. and J. Turner, 2003: Polar Lows: Mesoscale Weather Systems in the Polar Regions. Cambridge University Press, 628 pp. • Reed, R. J., and M. D. Albright, 1986: A Case Study of Explosive Cyclogenesis in the Eastern Pacific. Monthly Weather Review, 114, 2297–2319. • Sanders, F., and J. R. Gyakum, 1980: Synoptic-Dynamic Climatology of the “Bomb”. Monthly Weather Review, 108, 1589–1606 • Unidata, 2013: Integrated Data Viewer version 4.1. University Corporation for Atmospheric Research • Wilhelmsen, K. (1985): Climatological study of gale-producing polar lows near Norway. Tellus A, 37A: 451–459. • World Meteorological Organization, 1973: The use of satellite pictures in weather analysis and forecasting. Issue 124 of Technical note, World Meteorological Organization Issue 333 of WMO, World Meteorological Organization
Hooray! Questions?