Download
1 / 17
180 likes | 299 Views
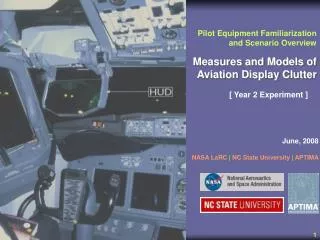
Measures and Models of Aviation Display Clutter. June, 2009 NASA LaRC | NC State University | APTIMA. Experiment Setup - Aircraft Familiarization -. Simulator with an Advanced PFD. VISTAS (Visual Imaging Simulator for Transport Aircraft Systems) Simulator No motion, ground-based simulator

E N D
Measures and Models of Aviation Display Clutter June, 2009 NASA LaRC |NC State University |APTIMA
Simulator with an Advanced PFD • VISTAS (Visual Imaging Simulator for Transport Aircraft Systems) Simulator • No motion, ground-based simulator • Integrated PFD & ND with new display features • Enhanced Vision System (EVS) • Synthetic Vision System (SVS) • Flight pathway guidance (TUNNEL) • Embedded NAV – standard LOC and G/S features
Advanced PFD Symbology Directed Altitude Directed Airspeed Actual Airspeed Current Altitude Directed Altitude Bug Directed Airspeed Bug Radar Altitude Vertical Speed Ind (VSI) DME
ILS Indicator • Localizer and Glideslope deviation • No “Bends” • No “Lies” • “Raw Data”
VSI Arrow Current Rate of Descent (Arrow) Commended Rate of Descent (Circle)
Tunnel + FPV • TUNNEL • “Crow’s feet” define vertical and horizontal extent of desired path • Generated by computer database with GPS system • 600 ft wide by 350 ft tall: • “Linear” Deviation • Segments every 0.2 nm • Showing path 1 nm ahead Flight Path Vector (FPV) Indicates where aircraft will go
ND Touchdown (TD) Point Course Line to TD Point Scale of Dotted Ring (NM)
SVS (Synthetic Vision System) Terrain • Wireframe • GPS-based
Side Stick Left + Right Button Aligns PFD waterline in the vertical center of the display Right Button Toggles PFD view between forward-looking and down-ward looking Left Button Re-centers flight symbology on the PFD Hat-Switch Controls rate of descent with fore and aft inputs. Each click equals 30 fpm
Flight Scenario Overview • ILS Approach and landing at a desert landing site • Consists with descending and hovering • Hand-flown with autothrottle • Pilot commands desired vertical speed with hat-switch on stick • Auto throttle adjust engine thrust to achieve vertical speed • Pilot adjusts airspeed with pitch (with fore & after) • Begins 7NM inbound to helipad • Ends with landing decision • Night/IMC: • Weather near or below minimums • Dust near ground • No approach lights or lighting of TD • Go-around or landing performance will not actually be measured
Descent Phase (3 deg glide path) Begin 250 KIAS 2460 MSL/HAT (1680 AGL) Stop and resume at random point 0 KIAS 250 ft MSL (250 ft HAT) Hover Phase Visual contact with the ground -Landing decision 100 ft MSL (100 ft HAT) 7NM End
Roles and Responsibilities • Captain • Hand flying with sidestick (Hdot + Manual mode) • Verbalize all decisions at decision height. • First Officer (FO) • Handle ATC communication • Provide callouts as briefed (altitude) • Will confirm objects in sight (visually) • Will answer queries and confirm settings, procedures, etc.