Download
1 / 31
310 likes | 435 Views
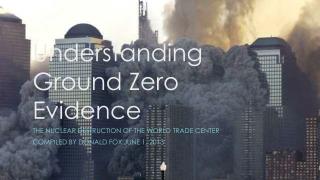
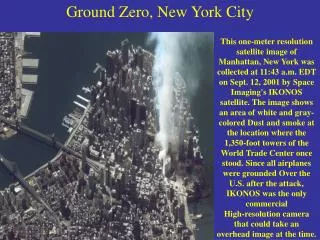
Ground Zero Dust Proof of Fission In NYC on 911. Vancouver, Canada June 2012 Compiled and published by Jeff Prager. The dust IS considered EVIDENCE. The dust coated everything and it’s our very best EVIDENCE. The 911 non-truth Movement has wholly ignored what I consider to be

E N D
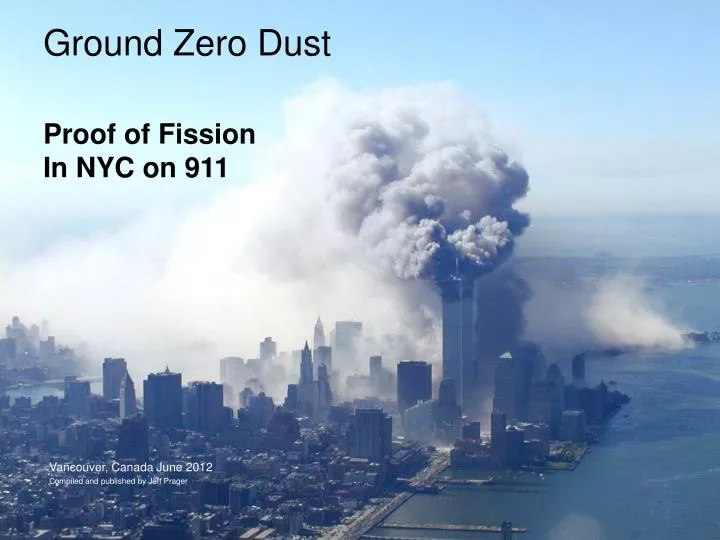
Ground Zero DustProof of FissionIn NYC on 911 Vancouver, Canada June 2012 Compiled and published by Jeff Prager
The 911 non-truth Movement has wholly ignored what I consider to be the very best evidence we could possibly ask for: We have the DUST
This Presentation References:(I encourage you to take notes)USGS Report # 01-0429(available on the internet)Environmental Studies Of The World Trade Center AreaThe September 11, 2001 Attack We follow the various elements found in the dust samples taken in lower Manhattan by the USGS team across over a dozen sample locations which then provide a snapshot of the events that took place on 911.It is critical to remember that we follow over a dozen elements across even more locations and these elements must be viewed as they interact together, not as separate elements. The elements we’re about to examine work together, as we should expect. Thus, one might expect to see the presence of uranium refuted. One might expect to see the presence of strontium or the other elements refuted individually. Yet when the elements are studied together as they increase and decrease predictably across a dozen locations the outcome is clear. The elements as they interact togetherand the tale they tell cannot be refuted. Fission occurred in NYC on 911.
How Do We Examine The Evidence? Today in the 21st century evidence is elemental; evidence is most often molecular in nature. We use DNA, blood tests, soil samples, hair, fibers and a variety of advanced analysis; often scanning electron microscopy (SEM) and other advanced methods are used. This Analysis Uses: • scanning electron microscopy (SEM), • scanning transmission ion microscopy (STIM), • high temporal resolution aerosol mass profiles (mass STIM) • proton elastic scattering analysis (PESA), in vacuum • synchrotron x-ray fluorescence (S-XRF), in vacuum • laser desorption ionization time-of-flight mass spectrometry (LDITOF-MS)
First I Want To Briefly Address The Cancer Epidemic Among First Responders • In the general population Multiple Myeloma occurs at the rate of 3-9 incidents per 100,000 people. That rate also occurs 99% of the time in people over 65. Just 1% are under the age of 65 in the general population and the average age of those afflicted is 71. See: Multiple Myeloma - A CDC Study of K-25 Workers http://www.cdc.gov/niosh/oerp/pdfs/k25_7-06-09.pdf • In the population of 40,000 First Responders the rate is 1 in 534 people. This means 75 First Responders (Source: John Feel, Feelgood Foundation, March 1, 2011) have died from Myeloma. What’s more, they have all been between 37 and 60 years of age with most under 55. These are extraordinary figures, unprecedented, and this report confirms why this is happening. Some sick First Responders have already died and have succumbed to not one, not two, but sometimes 3 different rare cancers. Multiple Myeloma in First Responders occurs at an unprecedented rate of over 18 people per 100,000 but just 3-9 per 100,000 in the general population. The statistics for non-Hodgkins Lymphoma and thyroid cancer are similarly much higher than would be expected. Other cancers as well are being seen in equally high incidence. The only time we’ve seen these various cancers increase at these levels and speeds has been during nuclear events; events such as Chernobyl, Hiroshima and Nagasaki.
Never before in history have we seen: • Non-Hodgkins Lymphoma • Multiple Myeloma • Leukemia • Thyroid Cancer • Pancreatic Cancer • Brain cancers • Prostate cancers • Esophageal cancers • Blood and Plasma cancers 100s have succumbed to rapid onset cancers, very rare cancers, cancers not seen anywhere else in this number, this rapidly, but as a result of exposure to radioactive events.
The city of New York is officially studying 345 First Responder cancer deaths, less than the true total cancer death figure. • As of March 1st, 2011, over 1000 First Responders have died (1,003), many from various cancers. • First Responders are still dying in unprecedented numbers today. Reggie Hilairehas now been diagnosed with multiple myeloma AFTER recovering from thyroid cancer last year
Here Is The Evidence We Use: Uranium Cerium Strontium Lanthanum Barium Yttrium Thorium Copper Potassium Lead Sodium Vanadium Zinc Titanium Molybdenum Antimony Lithium Manganese These Are The Elements We Follow While We Correlate Their Various Increasing and Decreasing Levels Across Numerous Mapped Locations Of Ground Zero Dust
The map found on the USGS web site indicates the location of each Ground Zero dust sample. The samples include 35 total sample locations with 2 indoor sample locations and 2 girder coating samples taken by the USGS team across the Ground Zero site. We use 14 of the 35 total samples taken and those 14 samples were chosen because they all contained measurable and unusually high amounts of strontium.
A sample of Chemistry Table 1 from the USGS open source web site.
First we’ll examine how the following elements interact in the Ground Zero dust samples: Strontium Barium Uranium Thorium Potassium Sodium Zinc
Strontium & Barium People might argue that strontium and barium could be found in building debris and they would be correct however strontium and barium could never, under any circumstances, be found as building debris constituents in a demolition in these quantities. The levels never fall below 400ppm for Barium and they never drop below 700ppm for Strontium and they reach over 3000ppm for both of them at WTC01-16, Broadway and John Streets. Why? Barium and Strontium are rare Trace elements with limited industrial uses. The enormous peak in Barium and Strontium concentration at WTC01-16 is readily apparent in the chart at right. The concentration of the two elements reaches 3130ppm for Strontium and 3670ppm for Barium or over 0.3% by weight of the dust. This means that 0.37% of the sample was Barium and 0.31% of the sample was Strontium by weight at that location, WTC01-16, Broadway and John Streets. The Mean concentration for Barium including the very low girder coating samples is 533ppm and for Strontium it’s 727ppm. These are not Trace amounts. They are highly dangerous and extremely toxic amounts. They are also critical components of nuclear fission and the decay process. ~ Whatever created the strontium also created the barium ~
Here we’re plotting the concentration of Barium at each location against the Strontium concentration. The correlation between the concentrations of the two elements, Barium and Strontium is extremely high. The Coefficient of Correlation between the concentration of Barium and Strontium at the out-door and indoor sampling locations is 0.99 to 2 decimal places (0.9897 to 4 decimal places). So we have a Correlation Coefficient between the concentration of Barium and the concentration of Strontium of 0.9897, or near perfect. The maximum Correlation Coefficient that is mathematically possible is 1.0 and this would mean we have a perfect match between the two factors we’re examining and the data points would lie on a straight line with no variation between them.To obtain a Correlation Coefficient of 0.9897 with this number of measurements (14) around Lower Manhattan is very, very significant indeed. What this means is that we can say that there’s a 99% correlation in the variation in the concentration between these two elements. They vary in lockstep; they vary together. When one element varies so does the other. We can state with absolute mathematical certainty that any change in the concentration of one of these elements, either the Barium or Strontium, is matched by the same change in the concentration of the other. Whatever process gave rise to the presence of either the Barium or the Strontium must have also produced the other as well. Fission is the only process that explains this.
Next we come to the detection of measurable quantities of Thorium and Uranium in the dust from the World Trade Center, elements which only exist in radioactive form. The graph below plots the concentration of Thorium and Uranium detected at each sampling location. Again, the last two locations, WTC01-08 and WTC01-09, are for the two girder coating samples. The Uranium concentration follows the same pattern as Thorium, although the graph scale does not show this markedly. Uranium follows the dip at WTC01-03 and WTC01-16 but the highest concentration of Uranium also matches Thorium in the second girder coating, WTC01-09, at 7.57ppm. 7.57 greatly exceeds normal Trace element levels. This equals 93 Becquerels per kilogram. Normal background radiation is approximately 12Bq/kg to 40Bq/kg with 40Bq/kg the highest level we would expect to see. This girder contains more than twice the expected level of uranium. The second girder contained 30.7ppm of Thorium, 6 times as high as the lowest level of that element detected. Thorium is a radioactive element formed from Uranium by decay. It’s very rare and should not be present in building rubble, ever. So we have verifiable evidence that a nuclear fission event has taken place. As we said earlier, Thorium is formed from Uranium be alpha decay. An alpha particle is the same as a Helium nucleus, so this means we have one of the favored fission pathways: Uranium fissioning into a Noble Gas and the balancing elements, in this case Helium and Thorium.
Thorium and Lithium The graph of Thorium versus Lithium including the Girder Coatings has exactly the same form as the graph showing Thorium versus Uranium, also including the Girder Coatings. Without the two Girder Coatings the correlation of Thorium to Lithium in the dust is completely linear. We therefore have compelling evidence that this fission pathway of Uranium to Thorium and Helium, with subsequent decay of the Helium into Lithium, has indeed taken place. It is out of the question that all of these correlations which are the signature of a nuclear explosion could have occurred by chance. This is impossible. The presence of rare Trace elements such as Cerium, Yttrium and Lanthanum is enough to raise eyebrows in themselves, let alone in quantities of 50ppm to well over 100ppm. When the quantities then vary widely from place to place but still correlate with each other according to the relationships expected from nuclear fission, it is beyond ALL doubt that the variations in concentration are due to that same common process of nuclear fission. When we also find Barium and Strontium present, in absolutely astronomical concentrations of over 400ppm to over 3000ppm, varying from place to place but varying in lockstep and according to known nuclear relationships, the implications are of the utmost seriousness. Fission occurred in NYC on 911.
Zinc, Sodium & Potassium This graph (right) shows that (apart from the very high peak in Sodium levels for one of the indoor dust samples) the Sodium and Potassium concentrations both display this now characteristic peak at location WTC01-16, the corner of Broadway and John Street. Sodium has the same peak as Zinc at WTC01-22, the corner of Warren and West, and like Zinc, falls to a minimum in the girder coatings – far below the concentrations found in the dust. Potassium is very similar except its concentration was not a peak at WTC01-02, Water and New York Streets, but somewhat lower then the next location, WTC01-03, State and Pearl Streets. There are clear correlations and relationships here which show that the Potassium and Sodium concentrations did not arise at random. They are products of radioactive decay. Remember that Strontium is produced by a fission pathway that proceeds through the Noble Gas Krypton and then the Alkali Metal Rubidium. Similarly, Barium is produced through Xenon and the Alkali Metal Cesium. We know that Uranium fission favors these pathways through the Noble Gases. Just as radioactive isotopes of Krypton and Xenon decay by beta particle emission to produce Rubidium and Cesium, radioactive isotopes of Neon and Argon also decay by beta emission to produce Sodium and Potassium. We would indeed expect to find anomalous levels of these elements present – what was found is again consistent with the occurrence of nuclear fission.
We know beyond doubt that the only process that can cause Barium and Strontium to be present in related or correlated quantities and any process that can also cause Barium and Strontium to have such strong relational concentrations across different samples, is nuclear fission. We know that if nuclear fission had occurred that Barium and Strontium would be present and a strong statistical correlation between the quantities of each would be found, and we have that, in spades. What else do we have? Quite a lot. About 400ppm of Barium and Strontium were measured in two samples of insulation girder coatings (WTC01-08 and 01-09). The concentration of Strontium actually falls somewhat below that of Barium in the second girder sample, WTC01-09, as at WTC01-16, whereas in every other sample the level of Strontium discovered was higher then Barium. Given the elevated levels of Barium daughter products found in the second girder and even the highest level of Uranium found (7.57ppm just West of and behind Tower One) this shows that active fission was still ongoing in the second girder coating, in the very same way as at WTC01-16 and therefore more Barium was found then Strontium. In other samples where the rate of fission had slowed down to give way to decay, the concentrations of Barium and Strontium reverse, due to the different half lives. Barium isotopes have a shorter half life then Strontium isotopes so they decay more quickly and after a period of time when no new Barium or Strontium has been deposited, Strontium will exceed Barium. The fact that more Barium then Strontium was still found at WTC01-16 and WTC01-09 shows that the overall nuclear processes taking place were somewhat favoring Barium over Strontium and hence Zinc as well. The tighter cluster of Barium (400-500ppm) and Strontium (700-800ppm) concentrations across widely separated sampling locations in Lower Manhattan is cast iron proof that Nuclear Fission occurred. We know that Barium and Strontium are the characteristic signature of fission; they are formed by two of the most common Uranium fission pathways. The fact that their concentrations are so tightly coupled means that their source was at the very epicenter of the event which created the dust cloud that enveloped Manhattan. This was not a localized pre-existing chemical source which would only have contaminated a few closely spaced samples and left the remaining samples untouched. The very high concentrations of Barium and Strontium at location WTC01-16 shows that active nuclear fission was still ongoing at that spot; the dust was still “hot” and new Barium and new Strontium were being actively generated, actively created by transmutation from their parent nuclei.
The presence of Thorium and Uranium correlated to each other by a clear mathematical power relationship – and to the other radionucleide daughter products such as sodium, potassium, zinc, lithium, strontium and barium – leaves nothing more to be said. This type of data has probably never been available to the public before and it’s an unprecedented insight into the action of a nuclear device. September 11th, 2001, was the first nuclear event within a major United States city that we have incontrovertible proof for and this is without question the most closely held secret surrounding the events of September 11th, 2001. Anyone seriously interested in 911 truth will naturally be compelled to fully and thoroughly investigate the serious implications raised by this report personally, and I strongly encourage this. The material is complex yet if I can understand it anyone can. No one promised us that the answers to 911 would come easily. There’s more compelling and incontrovertible evidence I’d like to cover now. We’ll discuss the elements: Lanthanum Vanadium Yttrium Chromium Nickel Copper Lead Zinc
Concentrations of Zinc (Zn), Lead (Pb) and Copper (Cu) In this graph Zinc has been divided by a factor of 10 to avoid losing all the detail in the scaling if the ‘Y’ axis instead went up to 3000ppm. The variation in Lead is matched by the variation in Zinc almost perfectly across all sampling locations, including the Indoor and Girder Coating samples. The concentration of Copper follows that of Zinc with one distinct exception at WTC01-15, Trinity and Cortlandt Streets, just several hundred feet East of Building Four. There seem to be two Copper-Zinc relationships. If some of the Zinc was being formed by beta decay of Copper, then the high Copper at WTC01-15 could reduce Zinc, since formation of Zinc by that decay pathway would be retarded by material being held up at the Copper stage, before decaying on to Zinc. Therefore this graph does confirm that some of the Zinc was indeed being formed by beta decay of Copper. This would at least be a very small mercy for the civilian population exposed in this event since the Zinc isotopes formed from Copper are stable, i.e. they are not radioactive.
The copper found in the Ground Zero dust is indicative of nuclear fission. If we plot the concentration of Copper against Zinc and Nickel, we obtain the graphs pictured here. The concentration of Nickel was almost the same everywhere, except for the peak of 88ppm matched by the Copper peak of 450ppm. The Copper - Zinc relationship is very interesting, showing in fact two distinct relationships again depending on isotopic composition. There are two radioactive isotopes of Copper (Cu 64 and Cu 67) with short half lives of 12.7 hours and 2.58 days respectively which decay into Zinc isotopes. The other two isotopes (Cu 60 and Cu 61) decay the other way by positron emission into Nickel and in fact Cu 64 goes both ways, into both Nickel and Zinc. This would explain why there strongly appear to be two Copper - Zinc relationships. The decay of radioactive Copper by beta particle emission into Zinc would have been another source for the extraordinarily high concentrations of Zinc found in the World Trade Center Dust. Copper (Cu) vs Nickel (Ni) Copper (Cu) vs Zinc (Zn)
Barium (Ba) Versus Lanthanum (La) Lanthanum is the next element in the disintegration pathway of Barium, situated between Barium and Cerium. The concentration of Barium versus Lanthanum is plotted in the graph below. This graph is almost identical in form to the relationship between Barium and Cerium. A similar inverse exponential (cubic) relationship is clearly visible. In this case, Lanthanum is approximately equal to 5 times the cube root of Barium. Lanthanum has a much shorter half life then Cerium; most of its isotopes have a half life of only a few hours whereas beta decay by Cerium is measured in half life periods of a month to 10 months. Ceriums beta decay going back to Lanthanum occurs more quickly but Lanthanum’s beta decay going back to Barium occurs in a similar time-scale to that – a few hours, so we are left with the net effect of Lanthanums beta decay being much quicker than that of Cerium, so the concentration of Cerium remaining was higher than that of Lanthanum.
Yttrium is also a very rare element and should not be present in dust from a collapsed office building. Yttrium is the next decay element after Strontium. If we plot concentration of Strontium against Yttrium, we see what happens in the graph below. Strontium 90 has a much longer half life (28.78 years) than most Barium isotopes so we would not expect to see as high a concentration of Strontium’s daughter products as those that are produced from Barium. This is in fact what we see – the concentration of Cerium (next daughter product to Barium) is higher then Yttrium, the next daughter product to Strontium. Strontium (Sr) Versus Yttrium (Y) Without Girder Coating Samples
The presence of Chromium is also a tell tale signature of a nuclear detonation. It’s concentration is shown plotted against Zinc and Vanadium in the graphs below. There is a strong correlation between the Zinc and the Chromium concentration. The Coefficient of Correlation is high, 0.89. There is also an indication of strong correlation between Chromium and Vanadium within 6 points of lying on an almost perfect exponential curve, with one outlier, WTC01-03, the corner of State and Pearl Streets, of 42.5ppm where the Vanadium concentration reached its highest level. Chromium (CR) vs Zinc (Zn) Chromium (CR) vs Vanadium (V)
Looking at the data for Zinc we see that the Zinc concentration for WTC01-02, Water Street at the intersection of New York, is 2990ppm and this immediately stands out. In fact, for the outdoor samples, Zinc is the most common Trace element at all sampling locations, with generally between 1000ppm and 2000ppm except for this spike of nearly 3000ppm at WTC01-02. This equates to an enormous concentration of Zinc. 0.1% to 0.2% of Zinc in the dust overall and at WTC01-02, 0.299% of the dust was Zinc. This exceeds the concentration of the supposed “non-Trace” element Manganese and Phosphorous and almost equals the elevated Titanium concentration of 0.39% at that same location. What process produced the zinc?
WTC Dust Samples ・ Zinc ・ Barium ・ Strontium In the chart below we add the Zinc plot line in comparison with Barium and Strontium. The peak in Zinc concentration at WTC01-02 is also accompanied by a higher Barium and Strontium concentration for those elements than at any of the other locations except WTC01-16, but the concentrations of Zinc, Strontium and Barium all vary together in a similar way at all locations, except at WTC01-16 and in the girder coatings, which are the last two data points at the far right of the chart, WTC01-08 and WTC01-09.
If we include the data for WTC01-16, the Correlation Coefficient between the Zinc and Barium concentration is 0.007 to 3 decimal places, from which we can conclude that there is absolutely no correlation at all. But if we exclude that one sampling location, where Barium and Strontium concentrations peaked, the correlation coefficient between Zinc and Barium is 0.96 to two decimal places and between Zinc and Strontium, 0.66 to two decimal places. So what happened? Zinc ・ Strontium Zinc ・ Barium
This shows that the Zinc and Barium concentrations are closely related and if we exclude what must have been an extraordinary event at WTC01-16 as an outlier, the correlation is very good. The Product Moment Correlation Coefficient is 0.96. The concentration of Zinc is now 3 times the concentration of Barium but the correlation between Zinc and Strontium is not so clear, showing that the relationship must be more indirect. This is to be expected since Barium and Strontium are produced by different nuclear fission pathways. In spent nuclear fuel, Strontium is found as Strontium Oxide (SrO) – the Strontium produced by the nuclear fission explosion under the Twin Towers will certainly have been oxidized to SrO by the heat. SrO is extremely soluble in water, so some of the Strontium concentration results obtained may have been distorted by the rain water which fell on New York a few days after the towers were destroyed. There is a very strong linear relationship between Barium and Zinc found at the World Trade Center. This may indicate that a closely related nuclear sub-process gave rise to them, which produced 3 times as much Zinc as Barium by weight. If so, that would be a very unusual nuclear event. There is a lesser known nuclear process that accounts for this, which would be indicative of very high energies indeed. This process is known as Ternary Fission.
This report is excerpted from a longer and far more detailed and complex text available at the link on the following page. This report proves that on 911 we experienced a complex nuclear event. There is another component to the nuclear aspects of 911 not covered in this report and that component is fusion. We have ample evidence that fusion/fission devices were deployed in NYC on 911 and the report by Mr. Donald Fox at these Vancouver Hearings will cover the fusion component. The exact composition of the nuclear device isn’t being speculated upon here. I am asserting that 911 was the result of fusion/fission devices and this report proves, unequivocally, the fission component of the event.
http://www.datafilehost.com/download-b128ac41.html Link To Full Text