Download
1 / 1
10 likes | 107 Views
Optimizing Home Investment Strategies with a focus on energy efficiency saving opportunities By Brittany Hagedorn. The Problem

E N D
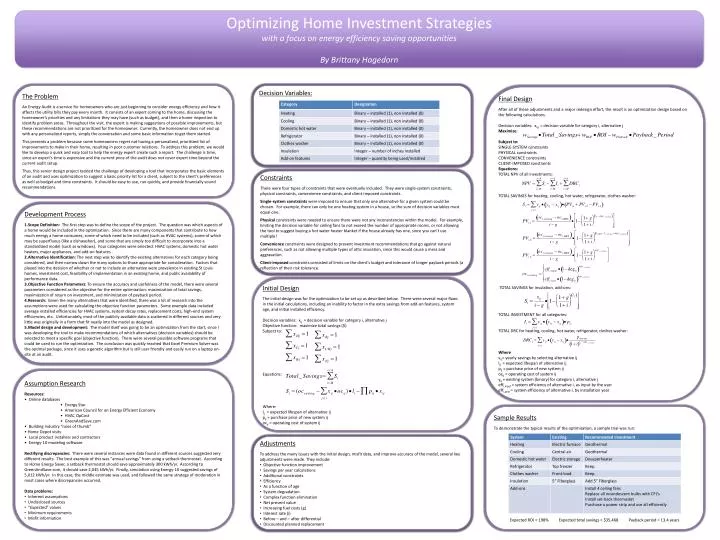
Optimizing Home Investment Strategies with a focus on energy efficiency saving opportunities By Brittany Hagedorn The Problem An Energy Audit is a service for homeowners who are just beginning to consider energy efficiency and how it affects the utility bills they pay every month. It consists of an expert coming to the home, discussing the homeowner’s priorities and any limitations they may have (such as budget), and then a home inspection to identify problem areas. Throughout the visit, the expert is making suggestions of possible improvements, but these recommendations are not prioritized for the homeowner. Currently, the homeowner does not end up with any personalized reports, simply the conversation and some basic information to get them started. This presents a problem because some homeowners regret not having a personalized, prioritized list of improvements to make in their home, resulting in poor customer relations. To address this problem, we would like to develop a quick and easy tool to help the energy expert create such a report. The challenge is time, since an expert’s time is expensive and the current price of the audit does not cover expert time beyond the current audit setup. Thus, this senior design project tackled the challenge of developing a tool that incorporates the basic elements of an audit and uses optimization to suggest a basic priority list for a client, subject to the client’s preferences as well as budget and time constraints. It should be easy to use, run quickly, and provide financially sound recommendations. Decision Variables: Final Design After all of these adjustments and a major redesign effort, the result is an optimization design based on the following calculations. Decision variables: xijj = decision variable for category i, alternative j Maximize: Subject to: SINGLE-SYSTEM constraints PHYSICAL constraints CONVENIENCE constraints CLIENT-IMPOSED constraints Equations: TOTAL NPV of all investments: TOTAL SAVINGS for heating, cooling, hot water, refrigerator, clothes washer: TOTAL SAVINGS for insulation, add-ons: TOTAL INVESTMENT for all categories: TOTAL DRC for heating, cooling, hot water, refrigerator, clothes washer: Where sij = yearly savings by selecting alternative ij lij = expected lifespan of alternative ij pij = purchase price of new system ij ocij = operating cost of system ij yij = existing system (binary) for category i, alternative j effi,input = system efficiency of alternative i, as input by the user effi,year = system efficiency of alternative i, by installation year Constraints There were four types of constraints that were eventually included. They were single-system constraints, physical constraints, convenience constraints, and client-imposed constraints. Single-system constraints were imposed to ensure that only one alternative for a given system could be chosen. For example, there can only be one heating system in a house, so the sum of decision variables must equal one. Physical constraints were needed to ensure there were not any inconsistencies within the model. For example, limiting the decision variable for ceiling fans to not exceed the number of appropriate rooms, or not allowing the tool to suggest buying a hot water heater blanket if the house already has one, since you can’t use multiple! Convenience constraints were designed to prevent investment recommendations that go against natural preferences, such as not allowing multiple types of attic insulation, since this would cause a mess and aggravation. Client-imposed constraints consisted of limits on the client’s budget and tolerance of longer payback periods (a reflection of their risk tolerance. • Development Process • Scope Definition: The first step was to define the scope of the project. The question was which aspects of a home would be included in the optimization. Since there are many components that contribute to how much energy a home consumes, some of which need to be included (such as HVAC systems), some of which may be superfluous (like a dishwasher), and some that are simply too difficult to incorporate into a standardized model (such as windows). Four categories were selected: HVAC systems, domestic hot water heaters, major appliances, and add-on features . • Alternative Identification: The next step was to identify the existing alternatives for each category being considered, and then narrow down the many options to those appropriate for consideration. Factors that played into the decision of whether or not to include an alternative were prevalence in existing St Louis homes, investment cost, feasibility of implementation in an existing home, and public availability of performance data. • Objective Function Parameters: To ensure the accuracy and usefulness of the model, there were several parameters considered as the objective for the entire optimization: maximization of total savings, maximization of return on investment, and minimization of payback period. • Research: Given the many alternatives that were identified, there was a lot of research into the assumptions were used for calculating the objective function parameters. Some example data included average installed efficiencies for HVAC systems, system decay rates, replacement costs, high-end system efficiencies, etc. Unfortunately, most of the publicly available data is scattered in different sources and very little was originally in a form that fit neatly into the model as designed. • Model design and development: The model itself was going to be an optimization from the start, since I was developing the tool to make recommendations of which alternatives (decision variables) should be selected to meet a specific goal (objective function). There were several possible software programs that could be used to run the optimization. The conclusion was quickly reached that Excel Premium Solver was the optimal package, since it uses a genetic algorithm but is still user friendly and easily run on a laptop on-site at an audit. Initial Design The initial design was for the optimization to be set up as described below. There were several major flaws in the initial calculations, including an inability to factor in the extra savings from add-on features, system age, and initial installed efficiency. Decision variables: xij = decision variable for category i, alternative j Objective function: maximize total savings ($) Subject to: Equations: Where: lij = expected lifespan of alternative ij pij = purchase price of new system ij ocij = operating cost of system ij • Assumption Research • Resources: • Online databases • Energy Star • American Council for an Energy Efficient Economy • HVAC OpCost • GreenAndSave.com • Building industry “rules of thumb” • Home Depot visits • Local product installers and contractors • Energy-10 modeling software • Rectifying discrepancies: There were several instances were data found in different sources suggested very different results. The best example of this was “annual savings” from using a setback thermostat. According to Home Energy Saver, a setback thermostat should save approximately 300 kWh/yr. According to GreenAndSave.com, it should save 2,045 kWh/yr. Finally, simulation using Energy-10 suggested savings of 5,012 kWh/yr. In this case, the middle estimate was used, and followed the same strategy of moderation in most cases where discrepancies occurred. • Data problems: • Inherent assumptions • Undisclosed sources • “Expected” values • Minimum requirements • Misfit information Sample Results To demonstrate the typical results of the optimization, a sample trial was run: Expected ROI = 198% Expected total savings = $35,468 Payback period = 13.4 years • Adjustments • To address the many issues with the initial design, misfit data, and improve accuracy of the model, several key adjustments were made. They include: • Objective function improvement • Savings per year calculations • Additional constraints • Efficiency • As a function of age • System degradation • Complex function elimination • Net present value • Increasing fuel costs (g) • Interest rate (i) • Before – and – after differential • Discounted planned replacement