Download
1 / 11
110 likes | 196 Views
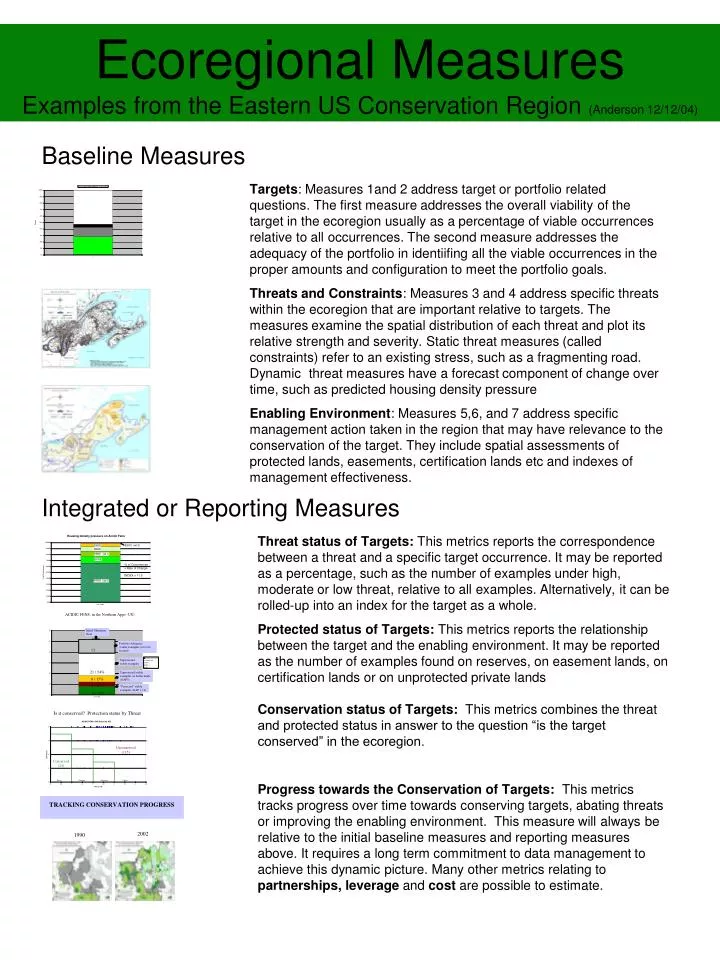
Ecoregional Measures Examples from the Eastern US Conservation Region (Anderson 12/12/04). Baseline Measures.

E N D
Ecoregional MeasuresExamples from the Eastern US Conservation Region (Anderson 12/12/04) Baseline Measures Targets: Measures 1and 2 address target or portfolio related questions. The first measure addresses the overall viability of the target in the ecoregion usually as a percentage of viable occurrences relative to all occurrences. The second measure addresses the adequacy of the portfolio in identiifing all the viable occurrences in the proper amounts and configuration to meet the portfolio goals. Threats and Constraints: Measures 3 and 4 address specific threats within the ecoregion that are important relative to targets. The measures examine the spatial distribution of each threat and plot its relative strength and severity. Static threat measures (called constraints) refer to an existing stress, such as a fragmenting road. Dynamic threat measures have a forecast component of change over time, such as predicted housing density pressure Enabling Environment: Measures 5,6, and 7 address specific management action taken in the region that may have relevance to the conservation of the target. They include spatial assessments of protected lands, easements, certification lands etc and indexes of management effectiveness. Integrated or Reporting Measures Threat status of Targets: This metrics reports the correspondence between a threat and a specific target occurrence. It may be reported as a percentage, such as the number of examples under high, moderate or low threat, relative to all examples. Alternatively, it can be rolled-up into an index for the target as a whole. Protected status of Targets: This metrics reports the relationship between the target and the enabling environment. It may be reported as the number of examples found on reserves, on easement lands, on certification lands or on unprotected private lands Conservation status of Targets: This metrics combines the threat and protected status in answer to the question “is the target conserved” in the ecoregion. Progress towards the Conservation of Targets: This metrics tracks progress over time towards conserving targets, abating threats or improving the enabling environment. This measure will always be relative to the initial baseline measures and reporting measures above. It requires a long term commitment to data management to achieve this dynamic picture. Many other metrics relating to partnerships, leverage and cost are possible to estimate.
Baseline Measure 1: Target ViabilityThis metric reports the current viability status of the target in the ecoregion Matrix Forest Ecosystems: a large matrix-scale target Acidic Fen Ecosystems: a patch-scale target Overall Viability Assessment: Good Viable occurrences were required to meet the following conditions Size over 20,000 acres 90% forested with at least 50 acres of old growth or mature forest Natural or semi natural landscape context Assessment revealed 215 roadless forest blocks over 20,000 acres. 180 met the other viability goals and ranked good to very good. 36 ranked fair and 31 ranked poor. 55,990 blocks were ranked as non-viable Viable blocks cover 47% of ecoregion; 53% of the region is fragmented into small non-viable blocks. • Overall Viability Assessment: Good • Viable occurrences were required to meet the following conditions • Size over 60 acres • Condition A or B or high expert opinion from ground survey. • Landscape context < 20 LCI • (LCI = landscape context index based on roads, developed and agricultural lands in surrounding 1000 acres) • Assessments revealed approximately 6000 acidic fens in the region with most of those being under 2 acres. • 202 acidic fens met the screening criteria for size and landscape context. Of those, 38 had excellent condition and were confirmed as viable portfolio occurrences..
Baseline Measure 2: Portfolio GoalsThis metric reports the adequacy of the portfolio with respect to the target. Matrix Forest Ecosystems: a large matrix-scale target Adequacy in Meeting Portfolio Goals: Meets All Goals Viable examples of matrix forests were carefully chosen to form a network that met the following goals: Representation and Distribution Goal: Identify and conserve a minimum of 1-3 forest sites in each color group* Abundance goal: A minimum of 38 sites (1 per group) Design goals: Maximize the inclusion of smaller scale targets including patch communities such as wetlands and cliffs, aquatic stream networks, especially headwater systems and rare species sites. Design coverage to include critical flows and pathways in the region such as source areas for lynx, marten and moose *color groups represent all forest types and all landscape settings – based on vegetation, geology, elevation, landform and climate Each forest-landscape combination is shown on the map as a different color. Acidic Fen Ecosystems: a patch-scale target Adequacy in Meeting Portfolio Goals: Below Goals This target has a deficit of 14 occurrences and is currently biased towards bedrock examples and higher elevations. Goals for patch-scale ecosystems and species were set based on the scale of the target (regional, matrix, large-patch, small-patch, fine) and the relative restrictedness of the ecosystem to the ecoregion (endemic, limited, widespread). The chart shows the distribution of viable acidic fens across elevation, bedrock, subsection and climatic zones. It reveals deficits in the portfolio in locating viable fens in low elevations and in coarse and fine sediment. Over all there is a deficit of 14 occurrences needed to meet our objective of protecting 52 in the ecoregion. Inventory is being performed to locate those examples
Static Measures (Constraints) Baseline Measures 3 & 4: ThreatsThese metrics measure the distribution, severity and trajectory of target-relevant threats Historic and current extraction patterns Historic clearing and over-extraction: The region is recovering from early 19th century clearing and harvesting that left the forest devoid of the structure and biological legacies that stabilize these ecosystems. In most places, these features need to be restored. Fragmentation: As the forests have re-grown an increasingly extensive network of roads has developed fragmenting aquatic networks and landscape functions and allowing access to forest interior regions. Acid deposition: The northeast is recognized as having elevated amounts of sulfur, nitrogen and ozone in its soils and streams The map shows acid deposition susceptibility patterns based on bedrock geology. Global Climate Change: Expected changes in climatic norms and extreme events are expected to cause major shifts in the distribution and abundance of species and greatly alter current hydrologic cycles. Numerous dynamic models exist for estimating change. Dynamic measures and Forecast models 1960 2050 Housing Density Pressure: The maps show measured and predicted changes in the distribution of urban (dk. grey), suburban (lt. grey),exurban (lt. green) and rural (dk. green) housing densities from the 1960s to 2050. Threat 2: Fragmentation Forest pests and pathogens: Newly introduced insects and diseases are threatening the health of many dominant tree species. The current distributions and the rates / directions of spread have been modeled.
Baseline Measure 5,6 &7: Enabling Environment: These metrics report the distribution, degree of protection and relative permanence of managed areas, easements, certification and other practices. Managed and Protected Areas Protection status of Land Tracts: GAP Status 1 indicates permanent protection for biodiversity with a management plan and natural processes intact –TNC reserves or Research Natural areas GAP Status 2 are permanently protected areas with some intervening management and suppression of processes - national wildlife refuge GAP Status 3 indicates permanent easements with various levels of regulated extraction (e.g. buffer land). Gap Status 4 (not shown) areas of forest certification, or non-permanent land owner agreements Ownership assessment of Management Effectiveness Measures of owner based effectiveness in enforcing or compliance with regulations aimed at biodiversity protection. In the Eastern US, where the legal system is very well developed and enforced, the measure is not as revealing as in some parts of the world. Bias in the Protected Area Distributions Current Protected areas were often chosen for scenic reasons or because they were not productive lands for agriculture or timber. The upper chart reveals that the current protected area network in the Northern Appalachians is strongly biased towards high elevations . Mid elevations spruce-hardwoods zone (1700 – 2500’), high elevation spruce-fir zone (2500’-4000’) and the alpine zone (over 4000’) constitute 42% of the protected areas although it is only 9% of the total ecoregion. The lower chart reveals that the protected area network is also biased towards acidic granitic bedrock settins that constitute 79% of the protected lands in spite of being only 25% of the total ecoregion. Sedimentary environments, particularly those with rich calcareous soils are poorly represented.
Housing Density 1960 Predicted Housing Density 2050 Acidic Fen Targets Integrated Reporting Measure: Threat Status of TargetThese metrics measure the distribution, severity and trajectory of target-relevant threats Housing Density Pressure on Acidic Fens: This metric measures of the rate and intensity of housing density changes from the 1960s to the 1990s and then forcast those changes into 2020 and 2050. Maps show Urban (dk. grey), Suburban (lt. grey), Exurban (lt. green) and Rural (dk. green). The rate of change and the severity of the threat may be evaluated for each occurrence by using a spatial overlay analysis. The chart on the left shows the distribution of housing density pressure on each acidic fen occurrence in the portfolio. Those with no housing pressure are shown in dark green (labeled RRRR. e.g. rural from 1960-1990-2020-2050) and constitute 65% of the portfolio. Highest threat pressures are on occurrences that were Exurban in 1960 and are now in suburban settings (top rows in red – labeled ESSS). The line graph on the right illustrates the relatively low amount of housing pressure on acidic fens compared with other ecosystems such as salt marshes (upper right). It is a whole system metric based on the % of target occurrences falling into each housing pressure category. Further roll-ups, across sytems or across the ecoregion, are possible.
Integrated Reporting Measure: Current State of Conservation: This metric reports the current state of conservation relative to a target Matrix Forest Ecosystems: a large matrix-scale target Forest blocks that meet core area goals (shown in green) Summary of forest block protection A Summary of Forest Protection: In the Northern Appalachian ecoregion, forest blocks are considered protected if they contain a designated core reserve area over 25,000 acres surrounded by an equal or grater amount of easement lands. The easements may allow for extractive activities, such as selective logging using best management practices, but the lands are prevented from direct conversion to development. Block-by-Block summary of Forest Protection: In the Northern Appalachians a protected network of 73 critical core forest areas, representing all forest-landscape types in the US is 36% complete. One million acres of strategically placed land protection would complete a network of core reserves in every block.
Integrated Reporting Measure: Current State of ConservationThis metric reports the current state of conservation relative to a target Acidic Fen Ecosystems: a patch-scale target Current Status of Acid fen protection Trajectory of protection for fens over time Acidic Fens Protection Summary: Sixteen acidic fens currently have some form of protection and 21 are unprotected (left chart). Inventory work, primarily through partner organizations or deeper assessment of TNC martix forest lands, have identified the 13 new viable fens to add to the portfolio (right chart, column 2). This metric allows us to track changes and measure our progress along the trajectory shown in the latter chart Wetland Ecosystem Target-by-Target Protection Summary: Acidic fens have some of the highest levels of protection in the ecoregion (far left in chart below). At the other extreme floodplain forests and calcareous seepage swamps are largely unprotected. No system is fully protected relative to the goals set by the ecoregional plan (dashed lines)
Integrated Reporting Measure: Conservation Progress over Time: These metrics report the distribution, degree of protection and relative permanence of managed areas, easements, certification and other practices. Matrix Forest Ecosystems: ten year protection sequence Core reserve Forest Easement Certification Portfolio Matrix Forest Blocks 1990 2002 Critical forest areas identified by The Nature Conservancy and others (outlined in gray) were mostly unprotected in 1990 (left chart). By 2002, many critical forest areas had a core reserve and buffer. Forest certification around the cores/buffer areas add an additional level of upgrading to un-protected lands that may be important to many species. • A comprehensive strategy of forest protection has been developed based on the ecoregional assessment of targets ant threats. The strategy has 4 major components: • Protect a network of large sites across all environmental gradients especially bedrock types and elevation zones –met through portfolio. • Develop Core Areas for restoration of complete biodiversity and biological legacies. • Embed the core areas in Buffer Regions targeted at maintaining forest structure. • Surround core/buffer focal sites with managed forest that adhere to Best Management Practices. For more information on the ecological approaches to forest conservation described here, go to www.sweetwatertrust.org/forestreserves
Integrated Reporting Measure: Conservation status of the TargetThis metric estimates the overall conservation status of the target Threats + Enabling Environment = Conservation Status Conservation Status of Acidic Fens in Lower New England: For this type of ecosystem, a target occurrence with a low to moderate threat status and high protection status may be considered to be conserved. Those with high threats are vulnerable even under high protection status. The chart below shows, in dots, the distribution of occurrences along two axes: protection status, as measured by GAP status, and threat status, as measured by housing density pressure. Other systems may need different variables or combined sets of variables to assess status. Low Un- protected Unconserved GAP 3 Protection GAP 2 GAP 1 High Low Threats High
Other Integrated Reporting Measures:Measuring Leverage and Partner ContributionsThis metric quantifies the contribution of partners to the protection of the target TNC protection work in 27 critical forest blocks When Partner contributions are accounted for, the amount of protection in the same 27 forest blocks increases over 10-fold Other Integrated Measures: There are numerous ways to combine the baseline measures to obtain useful metrics. In the figures above the left chart illustrates the Nature Conservancy’s work in protecting well over 100,000 areas of critical forest blocks in the Northern Appalachians. The chart on the right illustrates the contributions of other organizations (federal, state and private) to the protection of those same blocks highlighting the way the Conservancy’s work has enhanced or leveraged almost 10 times as much protection work on these targets. Accounting for the work of other organizations is a powerful way to build consensus and a necessary step in measuring success. Acidic fens: As with the forest sites, the protection of fens in the ecoregion is a collective effort of many organizations. The chart above illustrates the ownership pattern of the fens currently in a protected status of GAP 1,2,or3. Forests: The protection of one forest site can involve 2 or more partners. The chart above show the protection status of lands owned by various partner organizations within one forest site.