Download
1 / 3
30 likes | 97 Views
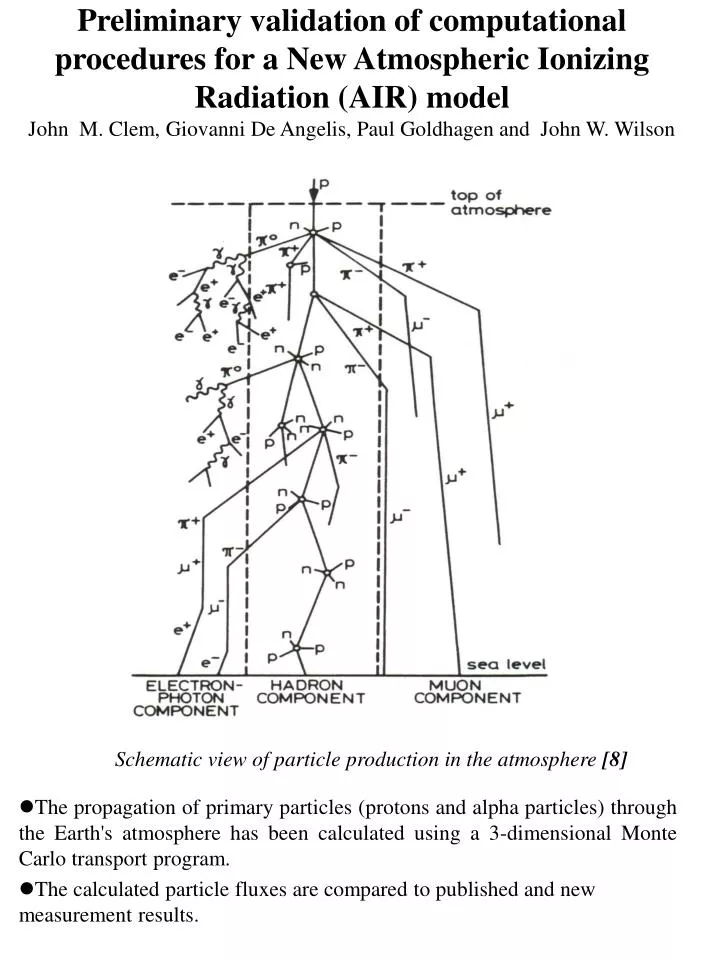
Preliminary validation of computational procedures for a New Atmospheric Ionizing Radiation (AIR) model John M. Clem, Giovanni De Angelis, Paul Goldhagen and John W. Wilson. Schematic view of particle production in the atmosphere [8].

E N D
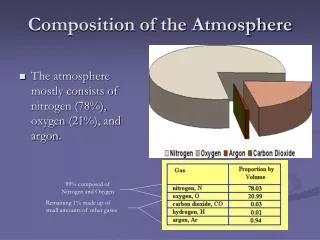
Preliminary validation of computational procedures for a New Atmospheric Ionizing Radiation (AIR) modelJohn M. Clem, Giovanni De Angelis, Paul Goldhagen and John W. Wilson Schematic view of particle production in the atmosphere [8] • The propagation of primary particles (protons and alpha particles) through the Earth's atmosphere has been calculated using a 3-dimensional Monte Carlo transport program. • The calculated particle fluxes are compared to published and new measurement results.
The atmosphere is divided into 180 (bottom boundary radius = 6378.14km) concentric spherical shells with differing radii. • Air density changes ~5% with each adjacent spherical shell while the air in each shell has an uniform density • The outer air-space boundary is radially separated by 65 kilometers from the inner ground-air boundary. • A single 1cm2 element on the air-space boundary is illuminated with primaries. Figure 2: Balloon and Space-Craft observations of primary cosmic rays during different times. Solid lines represent a global fit to all shown data
The calculated particle fluxes are compared to published and new measurement results. The absolute normalization of the simulated flux is determined from the number of generated primaries, weighted according to the expected primary spectrum (no free parameters in the comparison). The particle types compared are muons, protons and neutrons. The neutron measurements were performed aboard an ER-2 high altitude airplane during one of the lowest solar modulation periods (highest radiation levels) of the previous solar cycle (Jun-13 1997) [6,7]. Observations of sea-level protons and muons as published in Allkofer 1984 [8].