Download
1 / 9
90 likes | 201 Views
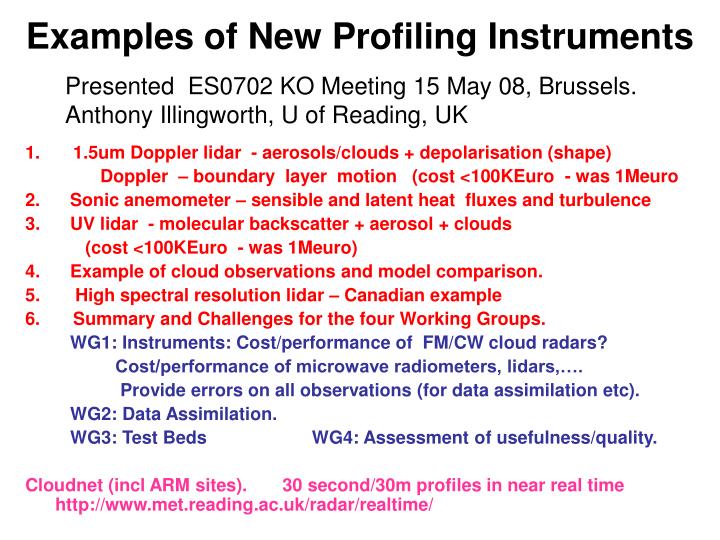
Examples of New Profiling Instruments. Presented ES0702 KO Meeting 15 May 08, Brussels. Anthony Illingworth, U of Reading, UK. 1.5um Doppler lidar - aerosols/clouds + depolarisation (shape) Doppler – boundary layer motion (cost <100KEuro - was 1Meuro

E N D
Examples of New Profiling Instruments Presented ES0702 KO Meeting 15 May 08, Brussels. Anthony Illingworth, U of Reading, UK • 1.5um Doppler lidar - aerosols/clouds + depolarisation (shape) Doppler – boundary layer motion (cost <100KEuro - was 1Meuro 2. Sonic anemometer – sensible and latent heat fluxes and turbulence 3. UV lidar - molecular backscatter + aerosol + clouds (cost <100KEuro - was 1Meuro) 4. Example of cloud observations and model comparison. 5. High spectral resolution lidar – Canadian example • Summary and Challenges for the four Working Groups. WG1: Instruments: Cost/performance of FM/CW cloud radars? Cost/performance of microwave radiometers, lidars,…. Provide errors on all observations (for data assimilation etc). WG2: Data Assimilation. WG3: Test Beds WG4: Assessment of usefulness/quality. Cloudnet (incl ARM sites). 30 second/30m profiles in near real time http://www.met.reading.ac.uk/radar/realtime/
1. HALO: 1.55m Doppler Lidar – aerosol & clouds: 11 Jul 2007 BACKSCATTER ice Cu aerosol up DOPPLER: + Depol ratio end of Oct. down convection
Most of incoming solar energy used for evaporation and transpiration Photosynthesis Turbulence 2. Sonic Anemometer +Licorr, H20 & C02 :Fluxes11 July 2007 (Robin Hogan: not yet on public web site)
Input of sensible heat “grows” a new cumulus-capped boundary layer during the day (small amount of stratocumulus in early morning) Surface heating leads to convectively generated turbulence Insects carried in updrafts to above the boundary layer top Convection is “switched off” when sensible heat flux goes negative at 1800
3. UV EZ 355nm Lidar: molecular, aerosol & clouds: 27Aug2007 (Ewan O’Connor: not yet on public web site) BACKSCATTER cirrus S’cooled Molecular Reference Gives opt depth Liquid Cu Mol +aerosol Aspherical ice DEPOL RATIO: SHAPE liquid Spherical liquid
4. 35 GHz radar 27 Aug 2007 UM output REFLECTIVITY (ND6) Spec Humidity ICE Insects Cu RH DOPPLER LWC IWC USE LIDAR TO SEE Sc and Cu Radar also has Doppler width + rate of turbulent energy dissipation. See ‘Cloudnet’ paper BAMS June 2007. VERT VELOCITY CLOUD FRACTION
5. High Spectral Resolution Lidar at 355nm – Ed Eloranta – Eureka 78N separates fast moving molecular return from slower aerosol/cloud return DEPOL RADAR aerosol/cloud DOPPLER Molecular as reference: any reduction gives Radar/Lidar ratio (D6/D 2) gives PARTICLE SIZE
Summary - Challenges WG1 – Need to review current instruments and performance. Radars, lidars, radiometers….wind profilers, GPS w vap. VAD. Amda. Cabauw, Sirta, Lindenberg, Potenza, Chilbolton…. Synergy – optimum combination of instruments to derive variables + error covariances. WG2 DA - Forward models. Jakobians. Error covariances/representativity Which models are ready to assimilate data? Cosmo-DE, Arome, UM 1.5km, Harmonie,2.5km, ecmwf…..? WG3 Test bed experiment(s). Instruments – network horizontal density? Temporary deployment of instruments. Training. + WMO support. Data format, availability and archiving. WG4 Assessing the usefulness and quality. Evaluation. Information content. Model bias. Extreme events. Case studies for processes – improved parameterisation schemes. Better initial state for models – on various scales? DA. Impact on NWP, climate models and observations? Cost effectiveness. Recommendations.