Download
1 / 10
100 likes | 188 Views
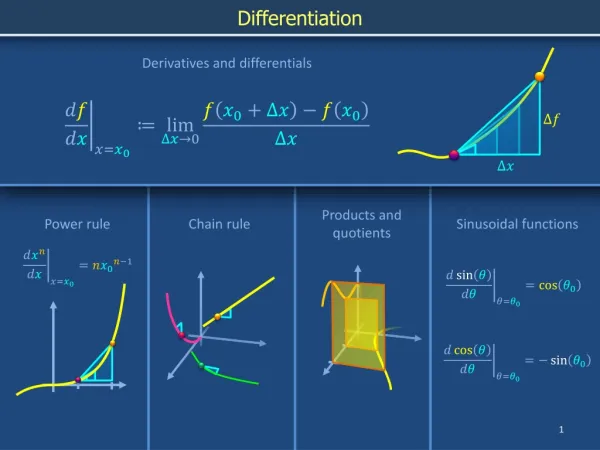
Applying Sinusoidal Graphs to different situations. There are many potential situations that could be modelled with periodic graphs. Example: Phases of the moon Tides Windmills Water wheels Ferris Wheels Bike tires Heartbeats Swings Builidings Swaying. Interpreting meaning.

E N D
There are many potential situations that could be modelled with periodic graphs • Example: Phases of the moon Tides Windmills Water wheels Ferris Wheels Bike tires Heartbeats Swings Builidings Swaying
Interpreting meaning • It is important to be able to assign meaning to the different things we observe in a repetitive pattern. • Let’s look at an example • Textbook: Pg 376 #20
Example cont.. The equation of the axis is h=8 It represents the height of the axle of the windmill. The axle is like the hub at the centre of the windmill around which the blades rotate. Axle
cont The amplitude is 6 metres It represents the length of the windmill blade.
Cont.. The period of the graph is 18 seconds It represents the amount of time it takes for the windmill blades to complete a full revolution.
Cont.. d) What sort of problems might we run into in trying to figure this out? Is it possible to figure this out. d) Given what we know so far it is possible to make the kind of transformation necessary to answer this? e)What will be the “a”, “c” and “d” values? e)We will have to modify our equation so that it won’t quite be totally accurate
Cont f) Would the affect be on a, c, or d? f) How might the graph change in general? The answer is that it will affect the period of the graph. It will make the period of the graph longer because a slower wind speed means it will take a greater amount of time for one cycle to be completed.
cont It would mean that the equation of the axis would be higher. The new equation of the axis would be h=9