Download
1 / 15
150 likes | 240 Views
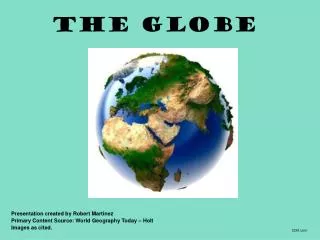
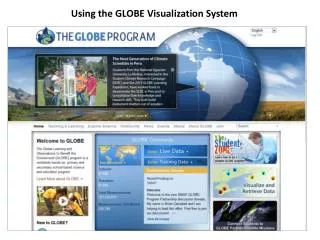
The GLOBE Earth System Poster Activity. 1-Exploring Single Images. Each group will need to do the following:. Study and interpret their images for available information. Determine your spokesperson for your group-They will report back to the class. . Questions to Answer.

E N D
Each group will need to do the following: • Study and interpret their images for available information. • Determine your spokesperson for your group-They will report back to the class.
Questions to Answer • What variable did you examine and what is the range of values shown on the scale bars? • Where in the world do you find the highest and lowest values (the extremes) of the data in your images? • Why do these locations experience the extremes and not other locations? • Are any patterns in the data noticeable? • Are patterns different on different continents? • Different over water than over land? Explain these patterns.
2-Exploring Annual Changes • Goals: • You will observe images as a group, looking for any changes that are occurring throughout the year. • Arrange your images in chronological order, beginning with January.
Identify annual cycles for your variable • What changes do you see through the year? • What explanations can you suggest for these patterns? • Choose a location or region. During which months do the extreme highs and lows occur? • What explanations can you suggest for the timing of those extremes? • Which regions experience both the extreme highs and lows? • Which regions don’t experience the extremes? Why do you think this happens? • What differences, if any, do you find between the year’s variations over the oceans versus the year’s variations over the continents? • Are there regions that remain relatively unchanged over the year? Why do you think this happens?
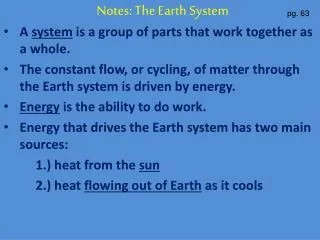
Understanding the Earth as a system requires a • quantitative exploration of the connections among various parts of the system.
3 Exploring Relationships Between Two Variables • Goals: • You will observe images from two variables, looking for possible relationships that are occurring throughout the year. The following groups will now pair up Group One (Insolation) with Group Two (Surface Temperature) Group Three (Cloud Fraction) with Group Four (Precipitation) Group Five (Aerosols) with Group Six (Biosphere)
Procedure • Arrange images in chronological order. • Line images next to each other (January next to January, etc.). • Identify the relationships and associations between the 2 variables.
Questions • What relationship do you see between: • insolation and surface temperature? • Cloud fraction and precipitation? • Aerosols and Biosphere? • Do the relationships appear to be directly or inversely proportional? Explain.
4-Exploring Relationships Among Variables for a Particular Month • Goals: • You will observe images from all six variables for one month, looking for possible relationships that are occurring between or among variables for their particular month.
Procedure • Return all images from your groups • Return to your original groups • Now you will get month labels as shown on the chart. • Each group will get images for all six variables for a single month.
Identify relationships among data for your month. • Which regions experience the extreme highs and lows for each variable? • Which regions don’t experience the extremes? Why do you think this occurs? • What differences, if any, do you find between variations of variables over the oceans versus variations in variables over the continents? • What amounts of insolation, surface temperature, cloud fraction, precipitation and aerosols characterize the world’s most vegetated regions for a particular month? • Where is the greatest concentration of aerosols originating from and how would you characterize that particular environment based on the six images?
5 - Exploring Relationships Among Variables Six Months Apart • Goals: • Your group will observe images from all six variables for two months, six months apart, looking for relationships and/or changes that are occurring among variables. Groups formed in activity four will come back and pair as follows. • Group One (January) with Group Four (July). • Group Two (March) with Group Five (September). • Group Three (May) with Group Six (November).
Line your global images next to each other by variable (Insolation January next to Insolation July, Surface Temperature January next to Surface Temperature July, etc.). • Identify the changes that occur in the six variables between the six-month period. • Which variables change the most over the six-month period? • Which variables change the least? • Why do you think this happens? • Do you see any relationships among the variables that you didn’t see previously?