Download
1 / 1
10 likes | 138 Views
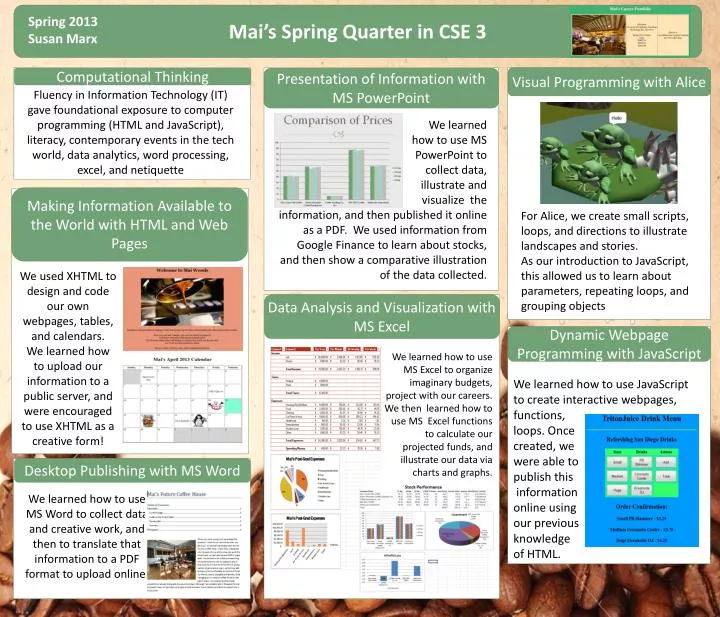
Mai’s Spring Quarter in CSE 3. Spring 2013 Susan Marx. Visual Programming with Alice. Presentation of Information with MS PowerPoint. Computational Thinking.

E N D
Mai’s Spring Quarter in CSE 3 Spring 2013 Susan Marx Visual Programming with Alice Presentation of Information with MS PowerPoint Computational Thinking Fluency in Information Technology (IT) gave foundational exposure to computer programming (HTML and JavaScript), literacy, contemporary events in the tech world, data analytics, word processing, excel, and netiquette We learned how to use MS PowerPoint to collect data, illustrate and visualize the information, and then published it online as a PDF. We used information from Google Finance to learn about stocks, and then show a comparative illustration of the data collected. For Alice, we create small scripts, loops, and directions to illustrate landscapes and stories. As our introduction to JavaScript, this allowed us to learn about parameters, repeating loops, and grouping objects We used XHTML to design and code our own webpages, tables, and calendars. We learned how to upload our information to a public server, and were encouraged to use XHTML as a creative form! Making Information Available to the World with HTML and Web Pages Data Analysis and Visualization with MS Excel We learned how to use MS Excel to organize imaginary budgets, project with our careers. We then learned how to use MS Excel functions to calculate our projected funds, and illustrate our data via charts and graphs. Dynamic Webpage Programming with JavaScript We learned how to use JavaScript to create interactive webpages, functions, loops. Once created, we were able to publish this information online using our previous knowledge of HTML. Desktop Publishing with MS Word We learned how to use MS Word to collect data and creative work, and then to translate that information to a PDF format to upload online.