1 / 0

Session II | Aging, Labor Force and Immigration

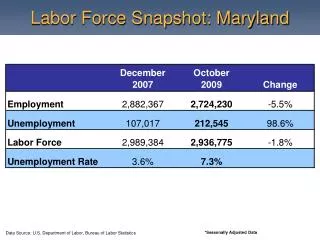
Session II | Aging, Labor Force and Immigration. Presented by: Gleb Nechayev , Senior Economist Arthur Jones , Senior Economist Abigail Rosenbaum , Senior Economist Luciana Suran , Senior Economist. Some Effects of an Aging Population . Key Drivers of Real Estate Demand.

oriana
Download Presentation

Session II | Aging, Labor Force and Immigration

An Image/Link below is provided (as is) to download presentation Download Policy: Content on the Website is provided to you AS IS for your information and personal use and may not be sold / licensed / shared on other websites without getting consent from its author. Content is provided to you AS IS for your information and personal use only. Download presentation by click this link. While downloading, if for some reason you are not able to download a presentation, the publisher may have deleted the file from their server. During download, if you can't get a presentation, the file might be deleted by the publisher.

E N D

Presentation Transcript


  1. Session II | Aging, Labor Force and Immigration

    Presented by: GlebNechayev, Senior Economist Arthur Jones, Senior Economist Abigail Rosenbaum, Senior Economist Luciana Suran, Senior Economist
  2. Some Effects of an Aging Population
  3. Key Drivers of Real Estate Demand Average annual change, % Sources: Bureau of the Census, BLS, CBRE Econometric Advisors.
  4. Why is Population Growth Slowing? Per 1,000 population Source: “The Changing Demographic Profile of the United States”, CRS Report to the U.S. Congress.
  5. Population by Age: Levels Population, millions Sources: Bureau of the Census, BLS, CBRE Econometric Advisors.
  6. Population by Age: Growth Population, millions Sources: Bureau of the Census, BLS, CBRE Econometric Advisors.
  7. Aging Population Has an Impact on Job Market Sources: Bureau of Labor Statistics, Census Bureau.
  8. More People Generally Means More Jobs Source: CBRE Econometric Advisors, Bureau of Labor Statistics, Census Bureau.
  9. Labor Force Contracted Cyclically for First Time… For the first time the labor force has actually declined Source: Bureau of Labor Statistics.
  10. Older People Staying More Attached to Labor Force Source: Bureau of Labor Statistics.
  11. But Aging Population Will Present a Problem Source: Bureau of Labor Statistics, Census Bureau.
  12. Developed Economies Face Similar Issues Source: World Bank
  13. U.S. Outlook Could Be Worse Source: European Commission.
  14. No Return to Renting Among the Seniors Homeownership rate, % Age Sources: Bureau of the Census, CBRE Econometric Advisors.
  15. Don’t Just Bet on the Young to Provide Tenants! 2012-2016 growth in renter households, ths. Scenario A assumes age-specific homeownership rates remain at current levels Scenario B assumes age-specific homeownership rates revert to long-term averages Sources: Bureau of the Census, CBRE Econometric Advisors.
  16. Pent-Up Demand to Rent Among the Elderly?
  17. Where is Pent-Up Rental Demand Among the Elderly?
  18. Who’s Spending the Most? Source: U.S. Census Bureau, Bureau of Labor Statistics.
  19. What are the Elderly Spending Their Money On? Source: BLS.
  20. Retail Sales in Cities with 20% Fewer Workers Per Capita;(like the US as a whole in 2030) Source: Census Bureau, CBRE Econometric Advisors.
  21. The Elderly Do Not Like to Drive (Average yearly vehicle miles traveled: 2009 NHTS) Source: NHTS.
  22. Age Profile of Native - Versus Foreign-Born in U.S. Source: Migration Policy Institute tabulations of the US Census Bureau's 2010 American Community Survey.
  23. Population Growth: Internal or External? Population growth between 2000 and 2010 and its components Source: OECD Population and Vital Statistics Database.
  24. Immigration and the Labor Force Contribution of international migration to growth in the labor force, 2000-10
  25. Immigration in the USA: Overview 40 million foreign-born people lived in the US in 2010 …making up 13% of the population Per-country ceilings: Immigrants from a single country can’t exceed 7% of total immigrants annually Annual worldwide limit of 675,000 legal immigrants Family reunification: up to 480k Diversity: 55k Employment-based: min. of 140k Sharp contrast to systems in Canada, UK, and Australia
  26. Immigration in the US: 1975 to 2050 Source: National Research Council. (2012). Aging and the Macroeconomy. Long-Term Implications of an Older Population. Committee on the Long-Run Macroeconomic Effects of the Aging U.S. Population. Board on Mathematical Sciences and their Applications, Division on Engineering and Physical Sciences, and Committee on Population, Division of Behavioral and Social Sciences and Education. Washington, D.C.: National Academy Press.
  27. Who Migrates Where…and Why?
  28. Immigration: Two Key Questions
More Related