Download
1 / 59
590 likes | 716 Views
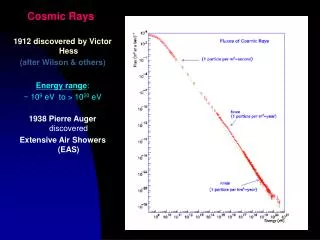
Cosmic rays and processes in the atmosphere. Yuri Stozhkov P.N. Lebedev Physical Institute, Russian academy of sciences.

E N D
Cosmic rays and processes in the atmosphere Yuri Stozhkov P.N. Lebedev Physical Institute, Russian academy of sciences
ContentIntroductionCR in the atmosphereIonization in the atmosphereAtmospheric electricityCR fluxes and atmospheric processesCR fluxes, Be-10 and C-14 atomsAbout global warming in futureConclusion
ContentIntroductionCR in the atmosphereIonization in the atmosphereAtmospheric electricityCR fluxes and atmospheric processesCR fluxes, Be-10 and C-14 atomsAbout global warming in futureConclusion
Energy fluxesSolar irradiation1.36· 103 W/m2Galactic cosmic rays(particles with Е > 0.1 GeV)10-5 W/m2
CR fluxes define general electric properties of the atmosphere and govern electric processes in it. Now we understand the main physical mechanisms being at the basis of such phenomena as global electric circuit operation, thunderstorm formation, lightning production and so on.
Sprites and elves triggered by the ground-to-cloud lightning (Lyons W.A., et al., 2000, EOS, v. 81, 373).
ContentIntroductionCR in the atmosphereIonization in the atmosphereAtmospheric electricityCR fluxes and atmospheric processesCR fluxes, Be-10 and C-14 atomsAbout global warming in futureConclusion
Green curve - cosmic ray flux (monthly data) at Pfotzer’s maximum at polar region (Rc=0.6 GV). Red curve - cosmic ray flux data smoothed with T=22 years.Blue line – calculation with a least square method
ContentIntroductionCR in the atmosphereIonization in the atmosphereAtmospheric electricityCR fluxes and atmospheric processesCR fluxes, Be-10 and C-14 atomsAbout global warming in futureConclusion
ContentIntroductionCR in the atmosphereIonization in the atmosphereAtmospheric electricityCR fluxes and atmospheric processesCR fluxes, Be-10 and C-14 atomsAbout global warming in futureConclusion
Mesoscale Convective Systems Mareev E.A., 2004; S. Davydenko et al., JGR, D5, 2004
Electric characteristics of the atmosphere Electric charge of the EarthQ - 600 000 C Electric field strength near the surface E130 V/m Electric current in the atmosphereJ10-12 A/m2Jtot2000 A
ContentIntroductionCR in the atmosphereIonization in the atmosphereAtmospheric electricityCR fluxes and atmospheric processesCR fluxes, Be-10 and C-14 atomsAbout global warming in futureConclusion
Relative changes of daily values of rainfall before Forbush-decrease (negative days), during the main phase of F-d (zero day), and after F-d (positive days). Rainfall data were collected from Brazil and USSR territories for the period of 1956-1993. 70 Forbush-events were analyzed: D = - (13.22.5) %. For Brazil data only (15 Forbush-events): D = - (29.27.5) %.
Relative changes of daily values of rainfall before solar proton event (negative days), during the solar proton event (zero day), and after it (positive days). Rainfall data were collected from Brazil and USSR territories for the period of 1942-1993. 43 solar proton events (particles with energy > several GeV) were analyzed: D = + (13.35.3) %. The superposed epoch method was used.
ContentIntroductionCR in the atmosphereIonization in the atmosphereAtmospheric electricityCR fluxes and atmospheric processesCR fluxes, Be-10 and C-14 atomsAbout global warming in futureConclusion
In the atmosphere cosmic rays (CR) produceBe-10, C-14 and other radionuclides. It is commonly supposed that the concentrationsof Be-10 in polar iceand C-14 in tree rings are good proxies of CR fluxes impinging on the top of the atmosphere. But before the precipitation on the Earth’s surface theseelements spend several years in the atmosphere. The atmospheric processes play an essential role in the radionuclideprecipitationand destroy the relationship between CR and radionuclide concentrations.
Kepler’s Supernova Remnant 10-year averages of C-14 data over the period of 859 - 1900; Yearly Be-10 data from Greenland for the period of 1423 - 1985; 22-year smoothed Be-10 data from Antarctica over the period of 859 - 1973
There is a large difference in the mean values of Be-10 concentrations obtained from Greenland and Antarctic ice cores. The <Be-10> concentrations in Greenland and Antarctica calculated over periods shown in the Figure are 1.05 and 3.86 (in the units of 104 atoms/g) accordingly. The correlation between Be-10 data from Greenland and C-14 data is low. After exclusion of the trend in C-14 dataset the maximum value of a correlation coefficient was 0.49 with a time shift of 6 years.
Correlation coefficient between Antarctic Be-10 data and C-14 data vs. time shift (C-14 Be-10).
Table 1. The ratios of maximum cosmic ray fluxes (CR) to minimum ones observed in the periods of minimum and maximum solar activity and the ratios of Be-10 concentrations during the same periods. t = t(Be-10) – t(CR) is the time shift between Be-10 and cosmic ray data. Periods 1954 to 1958 1965 to 1958 1965 to 1970 1977 to 1970 1977 to 1981 average CR fluxes ratio with E = (0.1-1.5) GeV 4.41 4.13 4.43 4.70 4.70 4.47 0.11 CR fluxes ratio with E = (0.1-5.8) GeV 3.09 2.82 2.58 2.61 2.97 2.81 0.10 CR fluxes ratio with E 0.1 GeV 2.61 2.45 2.29 2.26 2.5 2. 42 0.07 Be-10 ratio, t = 0 1.9 2.62 2.56 1.39 0.78 1.85 0.35 Be-10 ratio, t = 1 yr. 2.1 1.27 1.22 1.28 0.97 1.37 0.19 Be-10 ratio, t = 2 yrs. 1.37 2.07 2.43 1.77 0.61 1.65 0.31
The averaged amplitude of 11-solar cycle in Be-10 data from Greenland ice cores was found as where and where the values of CRzminand CRzminare the values of Be-10 concentrations during minima and maximaof sunspot number periods accordingly. Then the mean fractional ratio values <A> vs. different time shifts between Be-10 and solar activity data were calculated. and
The maximum mean value of <A> for Be-10data calculated over the period since 1711 till 1986 is 0.31 witha 4-year time shift. The mean value of <A> for CR (particles with E > 0.1 GeV), calculated over the period since 1954 till 1981 is 2.44 0.08. It means that the amplitude of 11-year modulation in CR is much bigger than in Be-10 produced by CR. The facts given above could be explained by the weather (climate changes) influence.
The different sets of data on radionuclides produced by CRs are agreed with each other not so well. The amplitude of variation in Be-10 data is much lower than that of CR in the 11-year solar cycle. The atmospheric effects play a main role in the variations of Be-10 and C-14 concentration. It is better to use the relationship of CR fluxes with sunspot number (correlation coefficient is ~ -0.9) to calculate the CR fluxes in the past.
References J. Beer, J., S. Tobias, and N. Weiss, Solar Phys., 181, 237 (1998). J. Beer et. all, The Sun as a Variable Star: Solar and Stellar Irradiance Variations (eds. J.M. Pap, C. Frahlich, H.S. Hudson and S.K. Solanki), Cambridge University Press, 291 (1994). M. Stuiver, P. J. Reimer and T. F. Braziunas, Radiocarbon, 40, 1127 (1998). Yu.I. Stozhkov, V.P. Okhlopkov, N.S. Svirzhevsky, Solar Physics, 224, 323 (2004). I. Hansen et al., JGR, 104, No. D24, 30,997 (1999).
ContentIntroductionCR in the atmosphereIonization in the atmosphereAtmospheric electricityCR fluxes and atmospheric processesCR fluxes, Be-10 and C-14 atomsAbout global warming in futureConclusion
One of the main weather parameter is the average temperature of the atmosphere surface layer. The temperature data were reduced to the values of dT = <dT> - T. The time dependences of Be-10 and dT data and correlation between them are shown below.